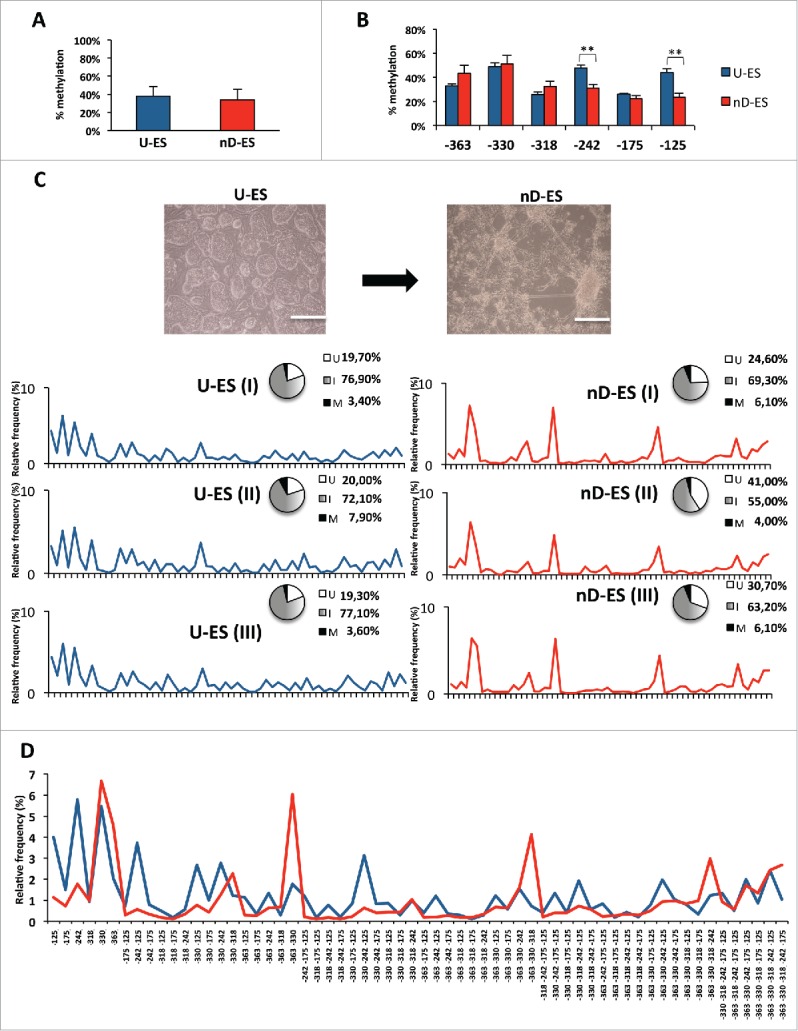
Figure 7.

Single molecule methylation analysis in ESC neural differentiation model. A) Averaged methylation at Ddo R4 region in undifferentiated ESCs (U-ES) and in differentiated ESCs (nD-ES) from 3 independent experiments. B) Averaged methylation of each CpG site (−363, −330, −318, −242, −175, and −125) at Ddo R4 region (data are showed as mean ± standard deviation; **P < 0.01). C) Microscope images of ESCs in undifferentiated state (U-ES) and upon differentiation toward neuronal phenotype (nD-ES). Bar = 200 µm. Epiallele frequency distribution in 3 independent ESCs differentiation experiments (I, II, and III). The pie charts represent the relative percentage of fully unmethylated epialleles (U = white), fully methylated epialleles (M = black), and the 62 intermediate epialleles (I = gray gradient). The line plots represent the frequency distribution of each of the 62 intermediate epialleles (blue: undifferentiated ESC; red: differentiated ESCs). D) Comparison between average frequency distribution of each of the 62 Ddo intermediate epialleles, from 3 independent experiments, in undifferentiated (blue line) vs. differentiated (red line) ESCs. The specific methyl CpG combinations of each of the 62 intermediate epialleles are indicated on the x-axis.
