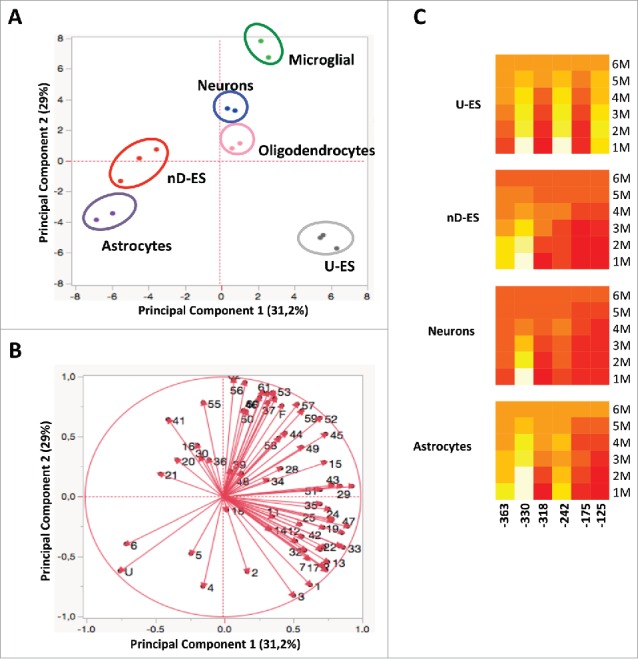
Figure 8.

Epigenetic correlation of Ddo R4 epialleles distribution in ES and different purified brain-derived cell types performed by PCA. A) Scores plot represents the distribution of each specific cell type (blue = neurons; pink = oligodendrocytes; green = microglial; violet = astrocytes; gray = U-ES undifferentiated ESCs, red = nD-ES differentiated ESCs). The analysis was based on the qualitative and quantitative influence of each of the 64 epialleles displayed by each cell type. B) Loading plots of PCA. The vectors represented by red arrows show how (the direction) and how much (the length) each epiallelic profile contributes to the individual correlations represented by PC1 and PC2. Note that each epiallele is named with numbers (1–62) or letters (U, F), as reported in Fig. 3B. C) The heatmaps show the contribution of each CpG in different epiallelic classes among 4 cell types (U-ES = undifferentiated ESC; nD_ES = neuronal differentiated ESCs). The color scale from red to yellow (from low to high values) shows the contribution of each CpG to formation of monomethylated (1M), dimethylated (2M), trimethylated (3M), tetramethylated (4M), pentamethylated (5M), and fully methylated (6M) molecules, respectively.
