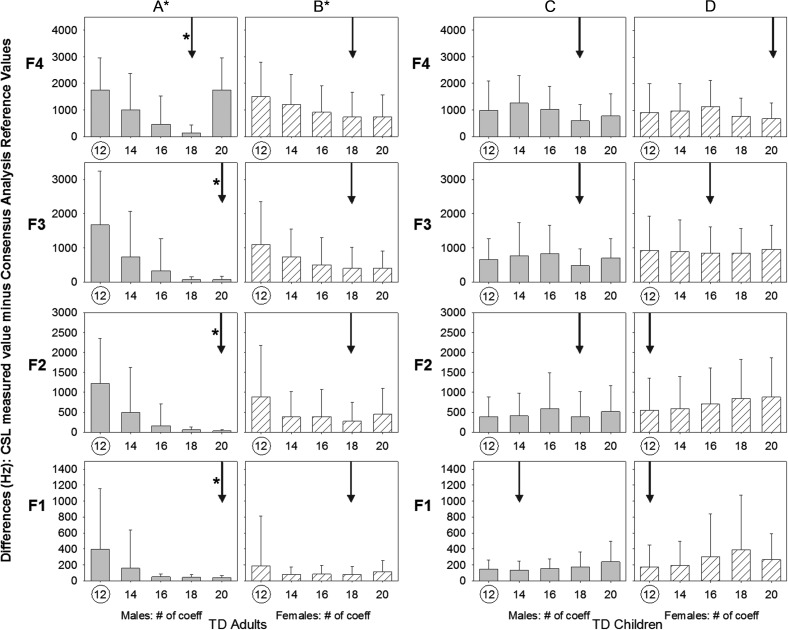
Figure 2.
Difference values for formant frequencies (F1–F4) using Computerized Speech Laboratory for typically developing (TD) male adults (panel A), TD female adults (panel B), TD male children (panel C), and TD female children (panel D). The vertical bar charts display the mean absolute difference (calculated by subtracting the consensus analysis reference values (CARVs) from Speech Acoustic Software Package (SAASP)-generated formant measurement at default and with all permissible parameter manipulations) pooled across the four corner vowels with the simple error bar representing the standard deviation from the mean. The circled number on the x-axis indicates the default analysis parameter and the arrow the optimal analysis parameter (the smallest difference between the SAASP-measured value and the CARVs). Statistical significance between default and optimal analysis parameter is denoted by an asterisk (*), where an asterisk to the left of the arrow indicates statistically significant differences for the individual formant, and an asterisk next to the panel letter indicates statistically significant differences across all four formants.

