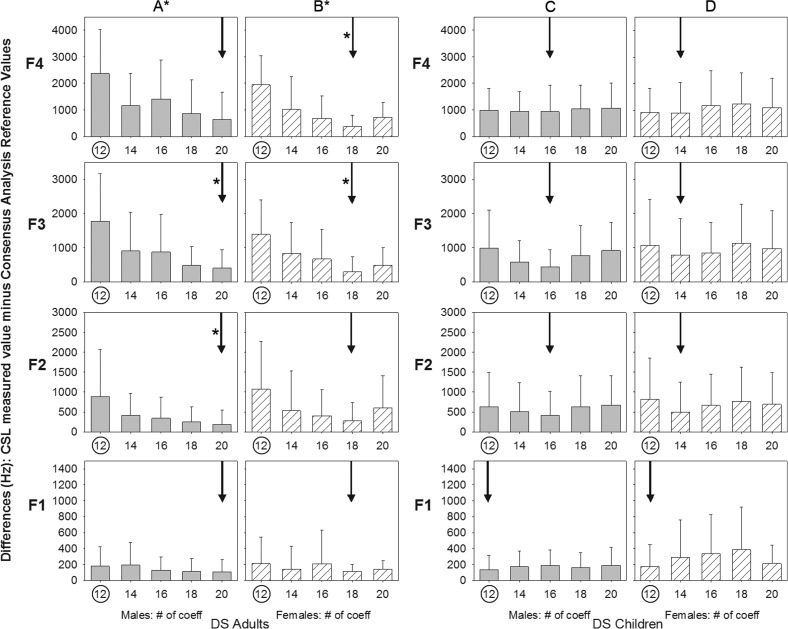
Figure 3.
Difference values for formant frequencies (F1–F4) using Computerized Speech Laboratory for male adults with Down syndrome (DS; panel A), female adults with DS (panel B), male children with DS (panel C), and female children with DS (panel D). Refer to the Figure 2 caption for additional information regarding vertical bar charts, default analysis parameter, optimal analysis parameter, and statistical significance.

