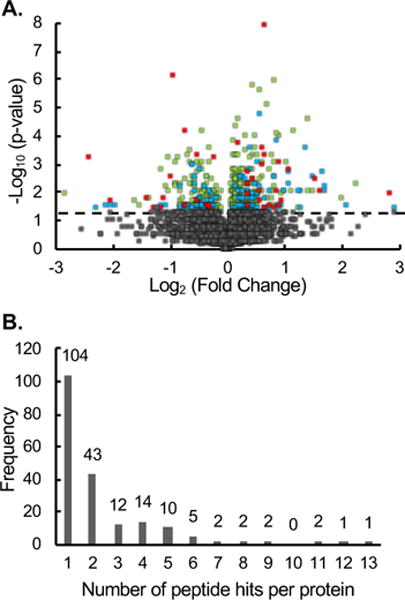
Figure 2.

Global analysis of the H/L ratios generated for the assayed peptides in the MCF-7 vs MCF-10A comparison. (A) Volcano plot of statistical significance against fold change between single and double digestion. The horizontal dashed line represents a p-value = 0.05. The grey points (n = 3853) represent non-hit peptides (p-value > 0.05). The green points (n = 304) represent peptides hits (p-value < 0.5) observed in four or five of the biological replicates. The blue points (n = 114) represent peptide hits (p-value < 0.05) observed in two or three of the biological replicates. The red points (n = 39) represent peptide hits (p-value < 0.05) observed in one biological replicate. (B) Bar graph showing the number of protein hits that were identified with multiple peptides
