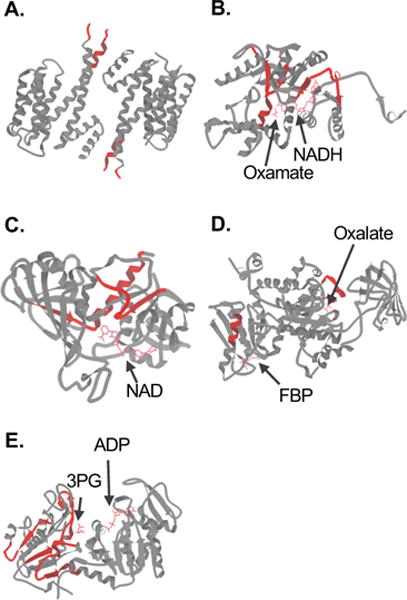
Figure 5.

Schematic representations of the folded three-dimensional structures of selected protein hits identified in the MCF-7 vs MCF-10A comparison. The nine antiparallel helices that comprise the 14-3-3σ homodimer (PDB 1YZ5) are shown in (A). The structure of LDHA in complex with NADH and the inhibitor oxamate (PDB 1I10) is shown in (B). The structure of GAPDH in complex with NAD (PDB 1ZNQ) is shown in (C). The structure of PKM2 in complex with Mg2+, K+, the inhibitor oxalate and the allosteric activator fructose 1,6-bisphosphate (FBP) (PDB 1T5A) is shown (D). The structure of PGK1 in complex with 3-phosphoglycerate (3PG) and ADP (PDB 2XE7) is shown in (E). In each case, the regions to which the peptide hits mapped are colored in red. Images were generated in KiNG (Kinemage, Next Generation).60
