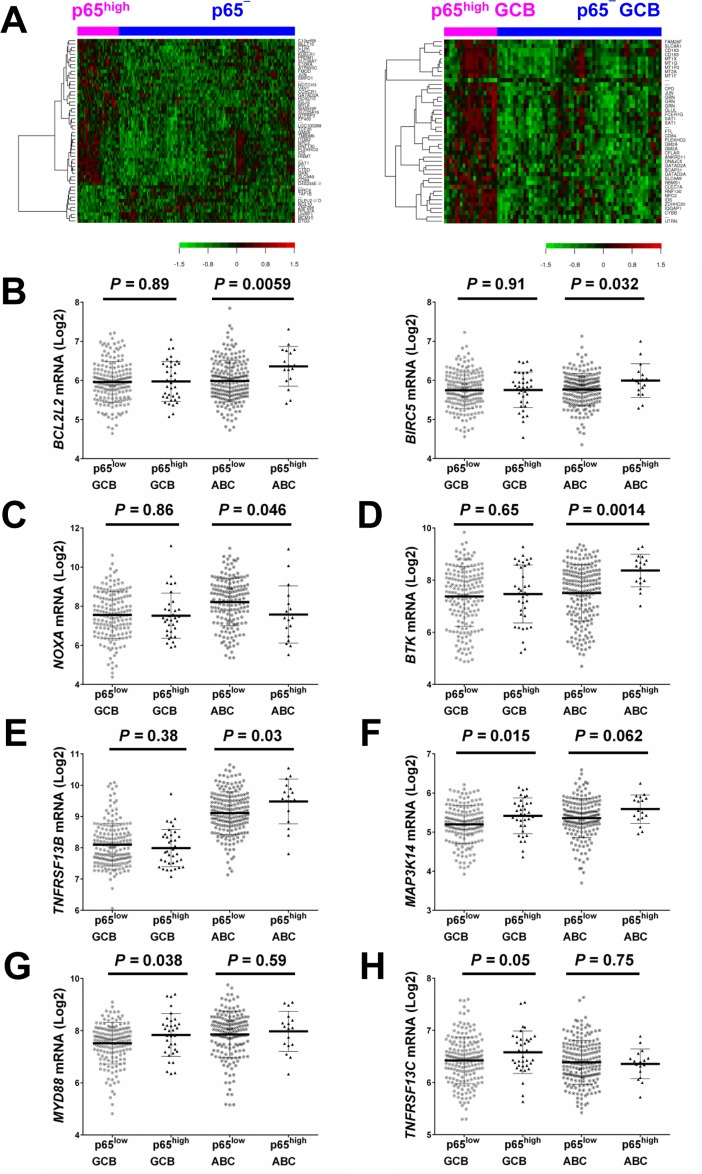
Figure 3. Gene expression profiling analysis.
(A) Heatmaps for comparisons between DLBCL patients with p65high expression (IHC ≥50%) and those without p65 nuclear expression (IHC <10%) in the overall and GCB-DLBCL cohorts (FDR <0.15 and FDR <0.05, respectively). (B) BIRC5/survivin and BCL2L2 were significantly upregulated in p65high ABC-DLBCL. (C) NOXA/PMAIP1 was significantly downregulated in p65high ABC-DLBCL. (D-E) BTK and TNFRSF13B were significantly upregulated in the p65high group in ABC-DLBCL but not in GCB-DLBCL. (F-H) MAP3K14/NIK, MYD88, and TNFRSF13C were significantly upregulated in the p65high group in GCB-DLBCL but not in ABC-DLBCL.

