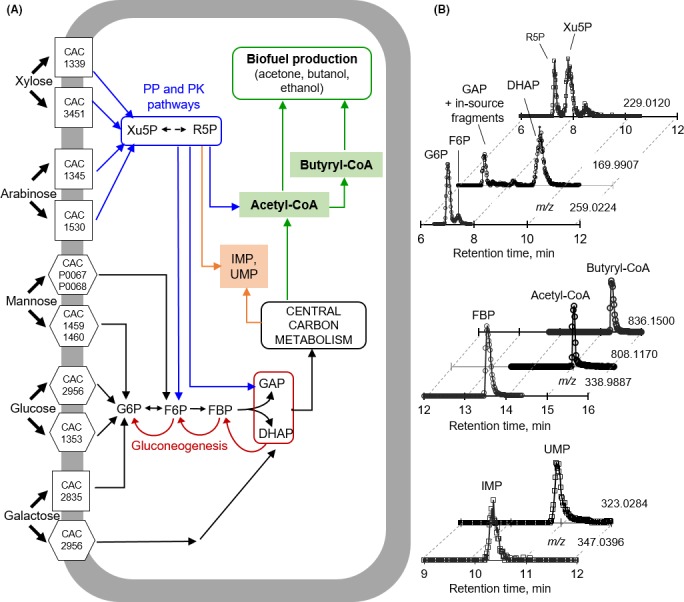
Figure 1.

Schematic central carbon metabolism and metabolite identification.
(A) Schematic routing of sugar catabolism towards biofuel production following sugar uptake in Clostridium acetobutylicum. The black lines represent catabolic pathways for the hexose sugars and in the central carbon metabolism, the blue lines represent catabolic pathways of pentose sugars through the pentose‐phosphate (PP) and phosphoketolase (PK) pathways, the dark red lines show reactions involved in gluconeogenesis; the genes reported to encode the sugar uptake transporters are shown (Servinsky et al., 2010).
(B) Liquid chromatography–mass spectrometry chromatogram of important metabolites isolated from glucose‐grown cells.
Abbreviations: G6P, glucose 6‐phosphate; F6P, fructose‐6‐phosphate; DHAP, dihydroxyacetone‐phosphate; GAP, glyceraldehyde‐3‐phosphate; Xu5P, xylulose‐5‐phosphate; R5P, ribose‐5‐phosphate; FBP, fructose‐1,6‐bisphosphate; Acetyl‐CoA, acetyl‐coenzyme A; butyryl‐CoA, butyryl‐coenzyme A; IMP, inosine monophosphate; UMP, uridine monophosphate.
