
Figure 2.
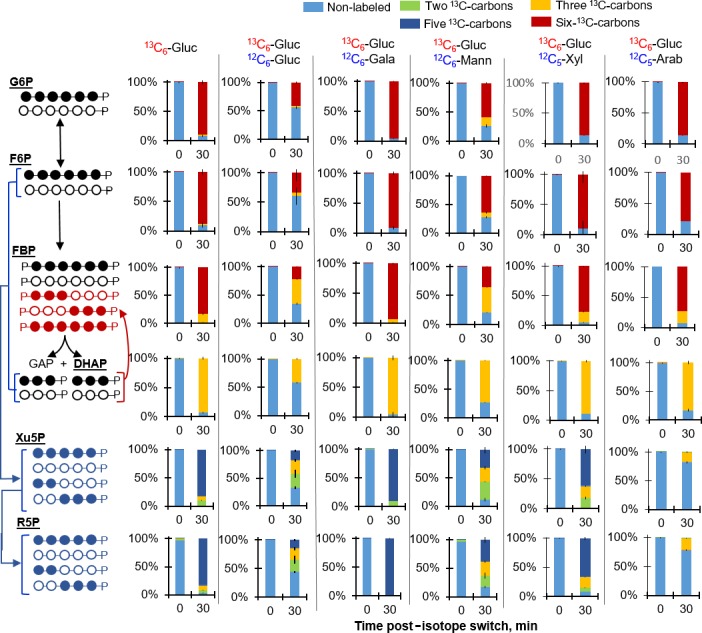
Mixed‐sugar catabolism of stable isotope‐labelled glucose with unlabelled glucose, galactose, mannose, xylose or arabinose.
The carbon mapping on the left illustrates the different labeling forms of the metabolites based on isotopic enrichment from substrate feeding. The filled circles and open circles represent, respectively, 13C‐labeled carbons and unlabeled carbons; black, red, and blue circles are assigned to labeling schemes in glycolytic, gluconeogenic, and pentose‐phosphate pathways respectively. Labeling of glycolytic and pentose‐phosphate pathway metabolites following 30 min incorporation of fully labelled glucose ([U‐13C6]‐Gluc) alone or with unlabelled Gluc, galactose (Gala), mannose (Mann), xylose (Xyl) or arabinose (Arab). The carbon mapping on the left illustrates the different labelling forms of the metabolites based on the fed substrate(s). Colour codes for the labelling isotopologues: non‐labelled carbon (light blue), two 13C‐carbons (light green), three 13C‐carbons (yellow); five 13C‐carbons (dark blue), and six 13C‐carbons (dark red). The measured data (average ± standard deviation) were from biological replicates (n = 2–3). Non‐noticeable error bars were in cases where standard deviation values were small.