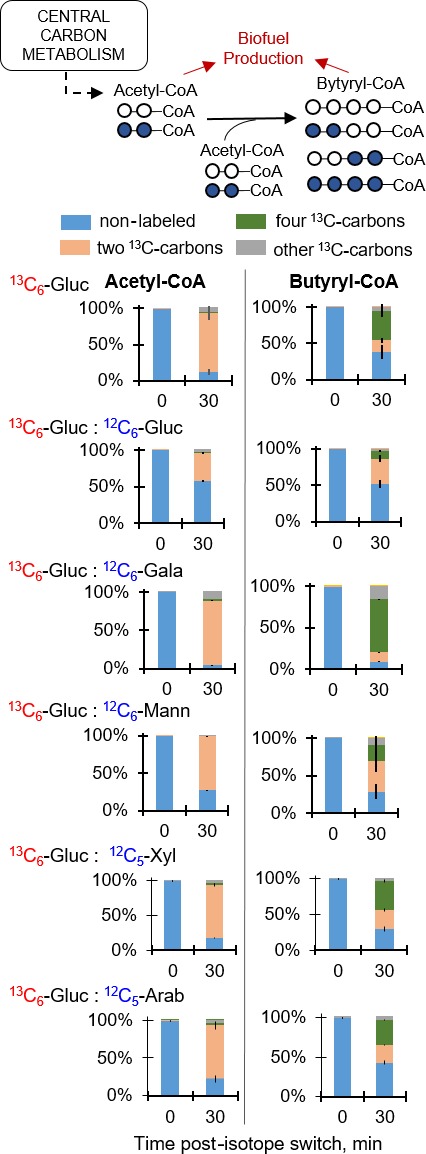
Figure 5.

Sugar investment in the biofuel precursors acetyl‐coenzyme A (acetyl‐CoA) and butyryl‐coenzyme A (butyryl‐CoA). Labelling patterns were obtained following 30 min incorporation of substrates as detailed in Fig. 2 legend. The measured data (average ± standard deviation) were from biological replicates (n = 2–3). Non‐noticeable error bars were in cases where standard deviation values were small.
