
Figure 2.
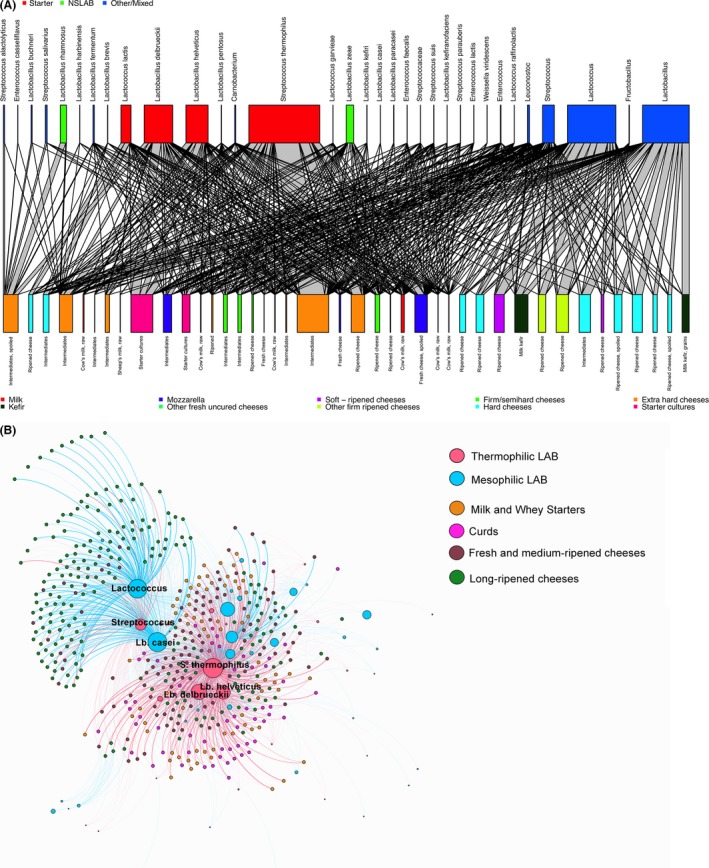
Graphical representations of the network structure of dairy samples extracted from Foodmicrobionet (v. 2.0). In (A), individual dairy samples are coulored according to the type of dairy product and aggregated by the state of the food (finished, intermediate, raw), the occurrence of spoilage, fermentation or ripening.