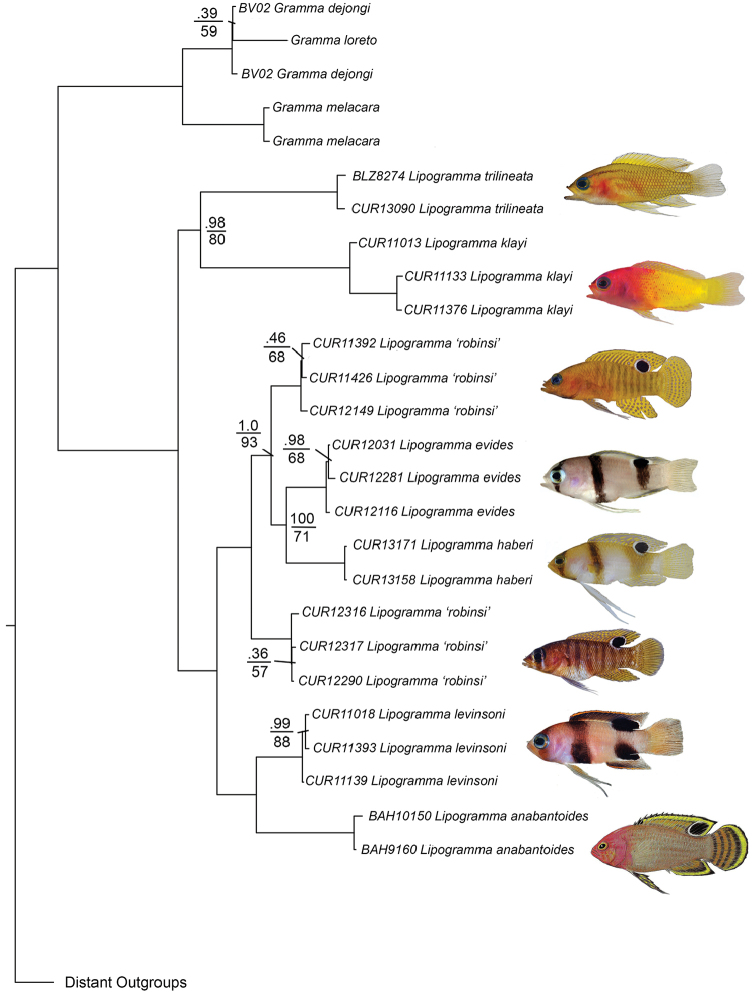
Figure 9.
Bayesian Inference molecular phylogeny of Lipogramma based on combined mitochondrial and nuclear genes. Numbers of individuals analyzed for each species are given in Appendix 1, along with the genes sequenced for each individual. Topology is identical to that from Maximum Likelihood analysis. Support values are Bayesian posterior probabilities (above) and bootstrap values (below). Nodes without labels have 1.0 posterior probability and 100 bootstrap values. Photos or illustrations by C. C. Baldwin, D. R. Robertson, R. G. Gilmore, and C. R. Robins.

