Figure 4.
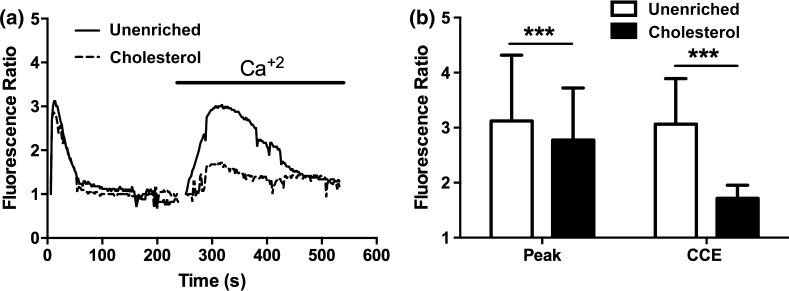
Cholesterol inhibits ATP stimulated capacitative calcium entry (CCE). Prior to the experiment, cells were incubated with PBS with Ca+2 (solid line) or 3.5 mM water soluble cholesterol (dashed line) for 30 min. (a) Representative traces of the Ca+2 response to 500 µL of 100 µM exogenous ATP in Ca+2 free PBS. After the initial response, the solution was replaced with 500 µL of PBS with Ca+2. (b) Bar graph representing the average responses for each condition at the initial response peak and the max after re-addition Ca+2, which represents capacitative calcium entry (CCE). Cholesterol enriched cells showed a slight reduction in the initial ER calcium response and a strong attenuation of the CCE calcium response as compared to unenriched cells. Average responses represent multiple coverslips (cs) and total cell count among coverslips (n) Unenriched: cs # = 5, n = 210; Cholesterol: cs# = 6, n = 321. Mean and SEM were plotted Two-tailed t test p < 0.0001.

