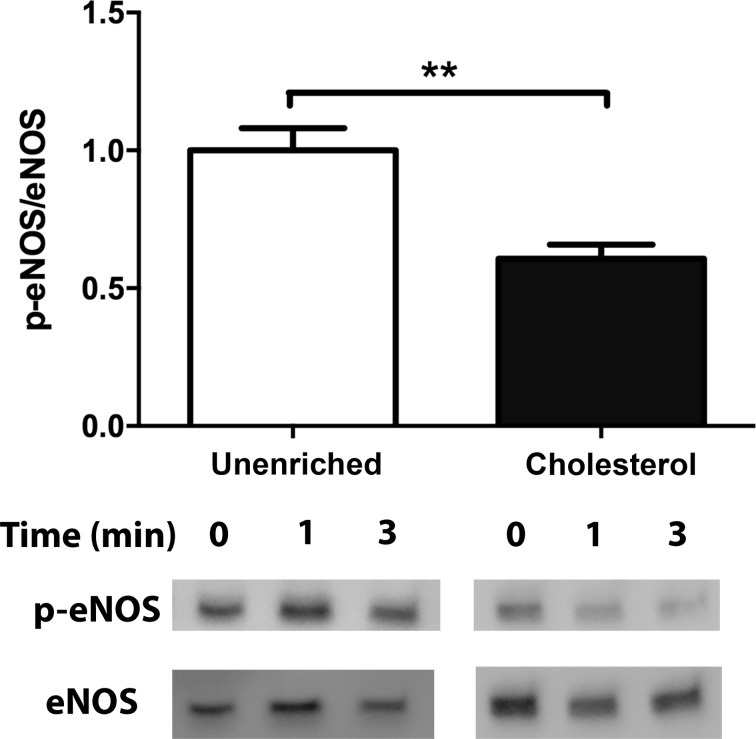
Figure 9.
Cholesterol impairs the shear stress-induced increase in eNOS phosphorylation. Bar graph representation of the ratio of phosphorylated eNOS to total eNOS for unenriched and cholesterol enriched cells following exposure to 10 dyn/cm2 for 3 min. The response is normalized by the unenriched control (Mean and SEM were plotted, ***p < 0.001 one-tailed t test n = 5 unenriched, n = 6 cholesterol).

