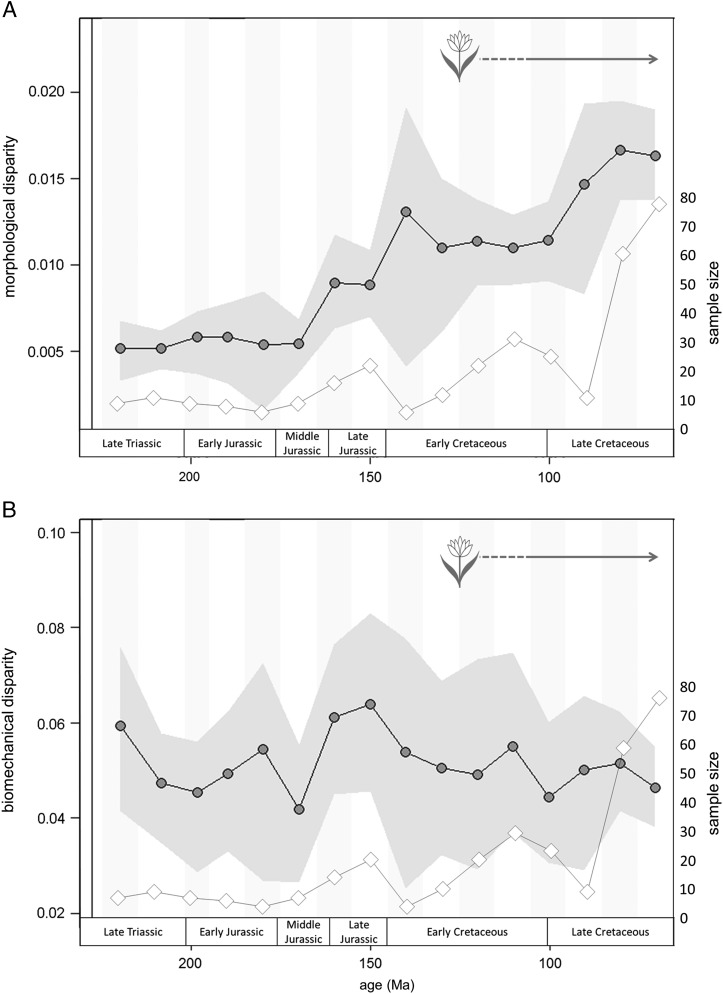
Figure 7.
Comparison of shape-based and biomechanical disparity curves across 10 Myr time bins based on sum of variance metric. (A) shape-based disparity; (B) biomechanical disparity. Morphological and biomechanical disparity curves are decoupled, with morphological disparity increasing through the Mesozoic and biomechanical disparity peaking in the latest Jurassic. Shaded region spans the 95% confidence intervals based on 1000 bootstrap replicates. Disparity (dots) is plotted alongside jaw specimen sample size curve (diamonds). Flower represents earliest fossil angiosperms (Sun et al. 2002; Du and Wang 2015).

