Fig. 3.

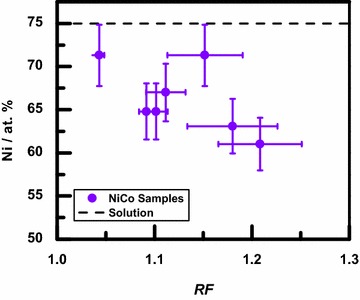
Ni composition for the NiCo samples as a function of the average roughness factor, , of the samples. Composition error bars represent the typical EDS uncertainty. The dashed line indicates the Ni composition in the deposition solution

Ni composition for the NiCo samples as a function of the average roughness factor, , of the samples. Composition error bars represent the typical EDS uncertainty. The dashed line indicates the Ni composition in the deposition solution