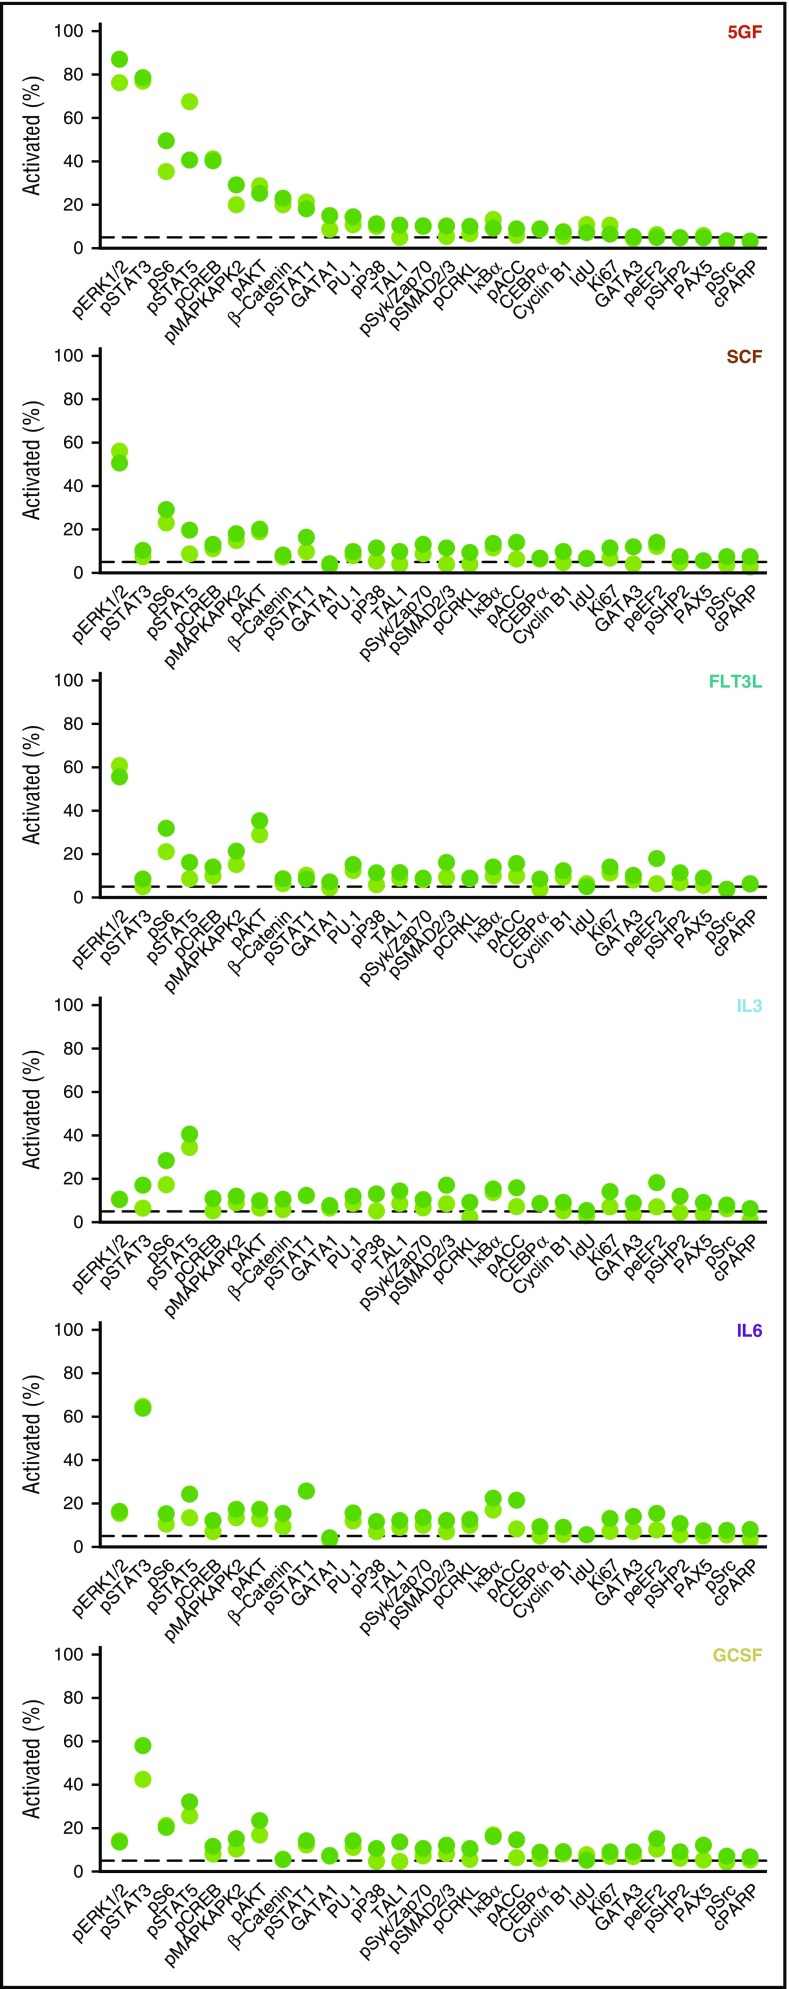
Figure 3.
Frequencies of CD33+ and CD33− subsets of CD49f+ CB cells exhibiting different GF-activated signaling responses. Cells were defined as activated when the measured levels were greater than the 95th quantile of unstimulated CD49f+ cells. The displayed frequency represents the maximum at any time point following stimulation with the indicated GF.

