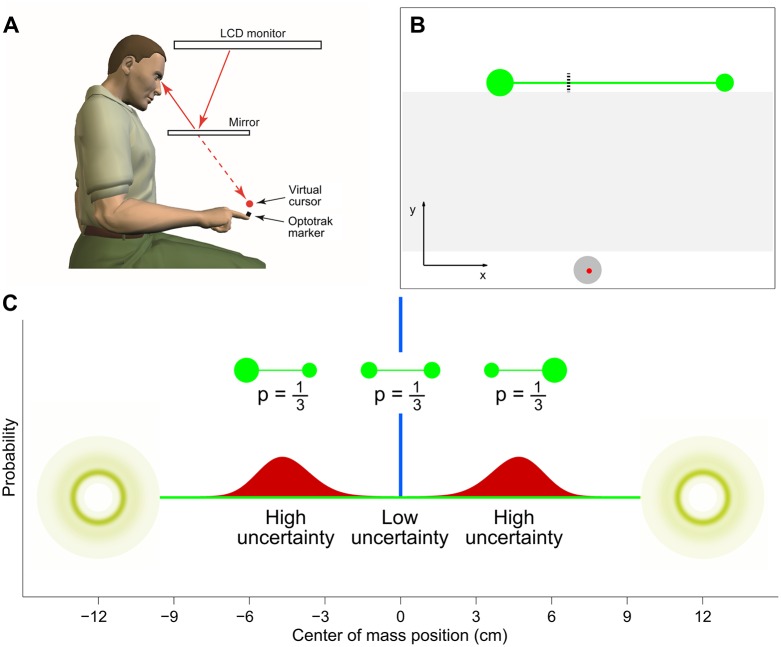
Fig 1. Experimental setup.
A: Subjects wore an Optotrak marker on the tip of their right index finger. The visual scene from a CRT monitor, including a virtual cursor that tracked the finger position, was projected into the plane of the hand via a mirror. B: The screen showed a home position at the bottom (grey circle), the cursor (red circle), here at the start of a trial, and the object at top (green dumbbell). The task consisted of locating the center of mass of the object, here indicated by the dashed line. Visual feedback of the cursor was removed in the region between the home position and the target line (here shaded for visualization purposes). C: The two disks were separated by 24 cm and, depending on the disks size ratio, the target (center of mass) was either exactly halfway between the two disks (p = 1/3; low uncertainty; blue distribution) or to the right (p = 1/3) or left (p = 1/3) of the midpoint (high uncertainty; red distributions), leading to a trimodal distribution of center of mass.

