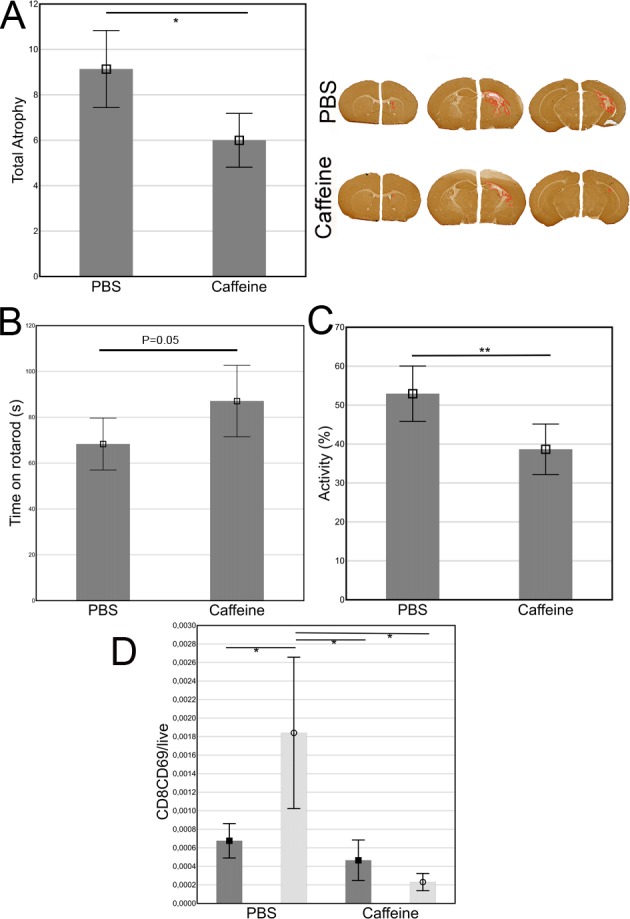
Fig 1. Improved outcome in caffeine treated animals compared to controls (n = 29 and n = 13 respectively).

A) Brain infarction was delineated by MAP-2 and atrophy calculated as 1-(Damaged hemisphere area including infarction area) / (Undamaged hemisphere area). The depicted brains are from the animals with injury size close to mean in each group respectively. B) Time spent on the Rotarod. C) Activity and velocity in the open field test was significantly decreased in the caffeine treated group. D) The only significantly altered population after caffeine compared to PBS treatment. Dark bars and squares represent sham operation and light bars with circles HI.
