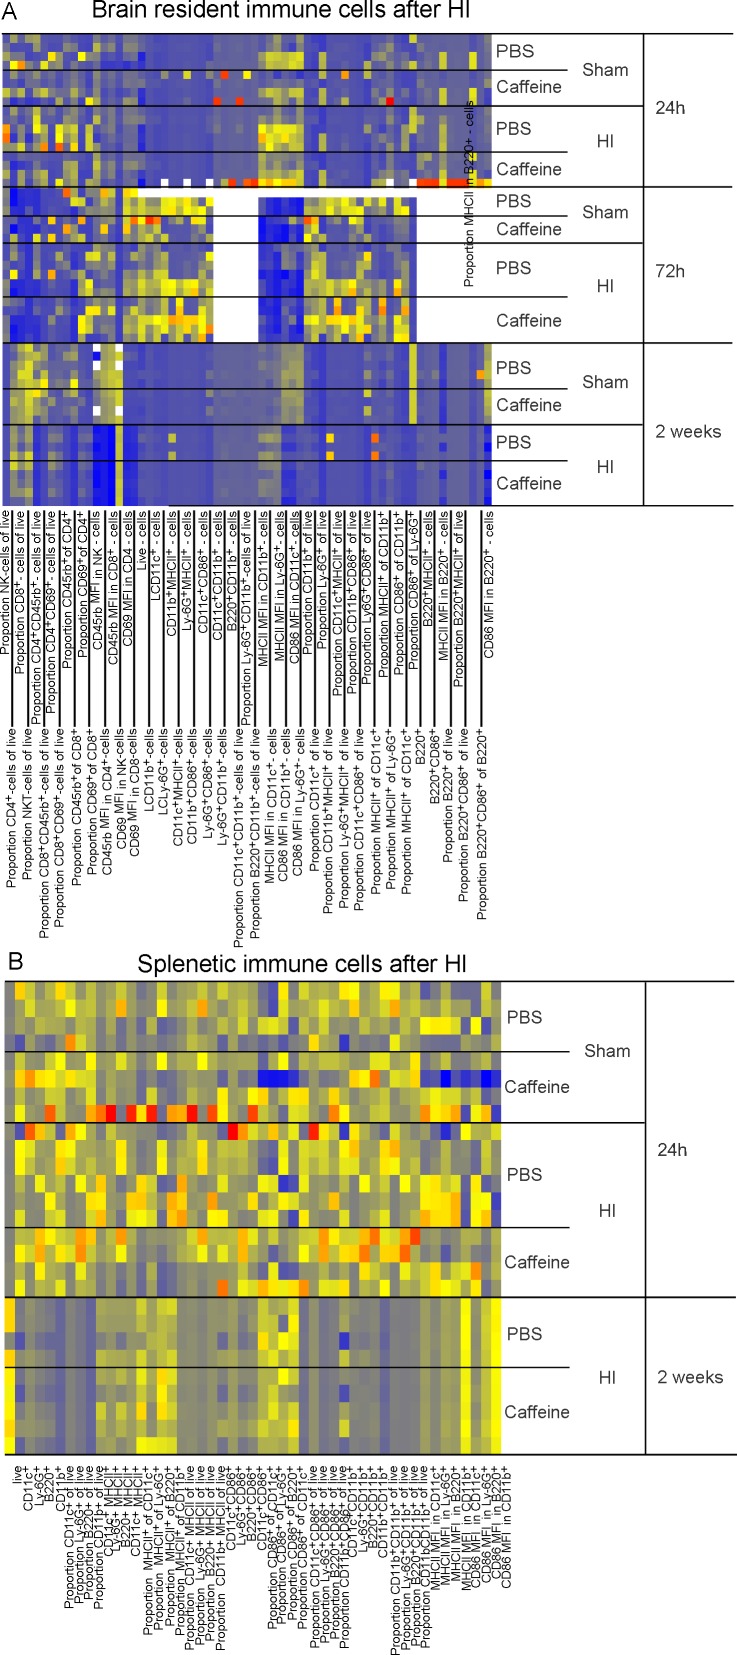
Fig 2. Heat map of all investigated immune populations after sham operation or HI 24h, 72h and two weeks after randomization to caffeine or PBS (n = 3–5 in each group, total n = 52).
The data was normalized to zero for the lowest value and one for the highest value in each variable with zeros in blue through yellow to ones values in red. Whites are missing values. MFI = Median florescence intensity.

