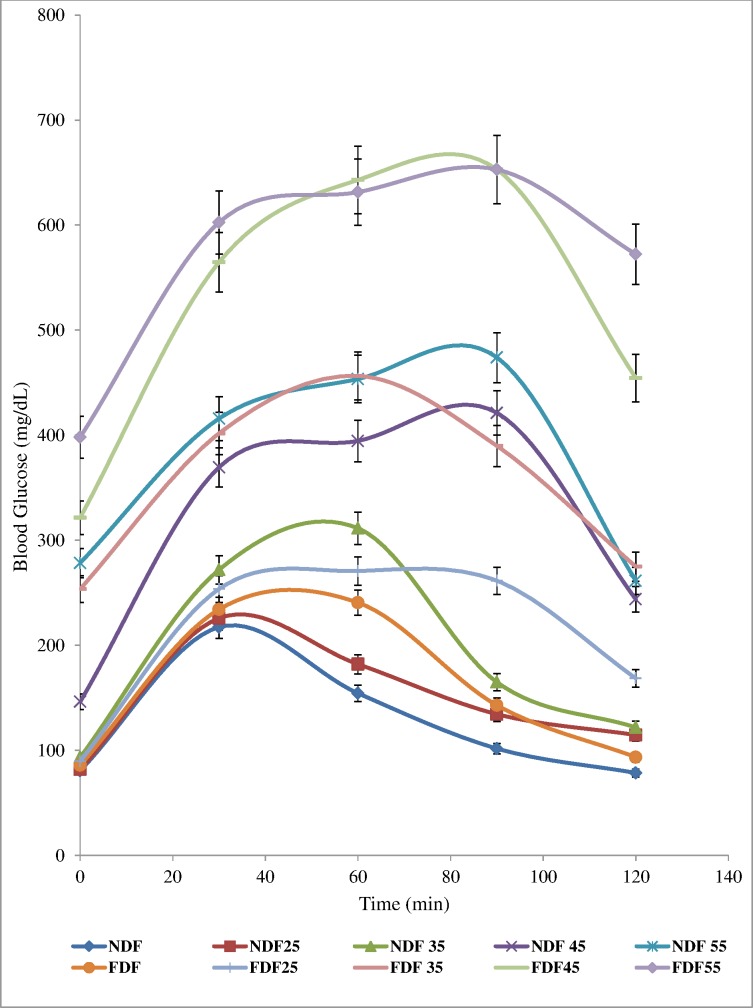
Fig 2. Oral Glucose Tolerance Test.
Data are presented as mean ± SD of 6–8 animals per group. NDF: Group fed with Normal Diet Feed + water and treated with normal saline as control NDF25: Group fed with Normal Diet Feed + Water and treated with 25mg/kg bw, STZ. NDF35: Group fed with Normal Diet Feed + Water and treated with 35mg/kg bw, STZ. NDF45: Group fed with Normal Diet Feed + Water and treated with 45mg/kg bw, STZ NDF55: Group fed with Normal Diet Feed + Water and treated with 55mg/kg bw, STZ. FDF: Group fed with Fortified Diet Feed + 20% fructose and treated with Normal saline FDF25: Group fed with Fortified Diet Feed + 20% fructose and treated with 25mg/kg bw STZ FDF35: Group fed with Fortified Diet Feed + 20% fructose and treated with 35mg/kg bw STZ FDF45: Group fed with Fortified Diet Feed + 20% fructose and treated with 45mg/kg bw STZ FDF55: Group fed with Fortified Diet Feed + 20% fructose and treated with 55mg/kg bw STZ.

