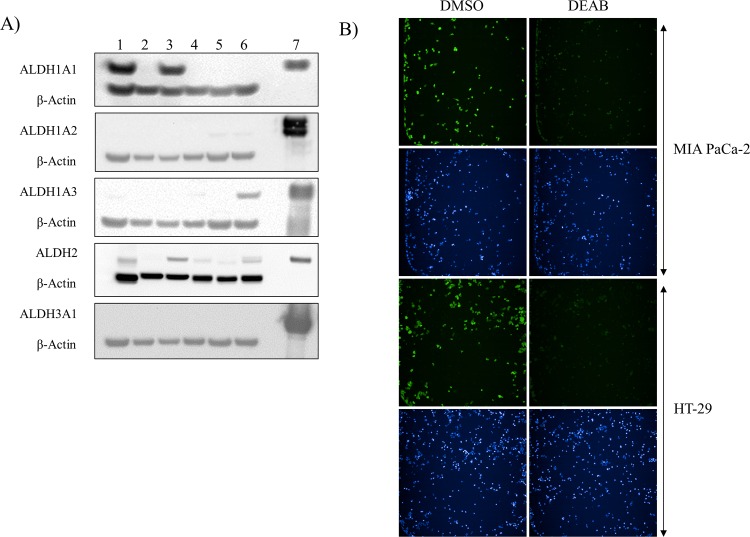
Fig 1. ALDH1A1 is differentially expressed in cancer cell lines and its activity can be indirectly visualized by BAA fluorescence.
(A) Protein extracts from pancreatic cancer cell lines MIA PaCa-2 (lane 1) and PANC-1 (lane 2), colon cancer cell lines HT-29 (lane 3) and SW480 (lane 4) and glioma cell lines LN-18 (lane 5) and LN-229 (lane 6) were analyzed by immunoblot for ALDH1A1, ALDH1A2, ALDH1A3, ALDH2 and ALDH3A1 expression. β-Actin was used as loading control. The corresponding recombinant protein was loaded for reference (lane 7). (B) Representative fluorescent images of MIA PaCa-2 and HT-29 cells incubated with 500 nM of BAAA substrate and treated with 22 μM DEAB or DMSO for 30 minutes. Green fluorescent images indicate intracellular BAA and blue fluorescent images indicate nuclei staining.

