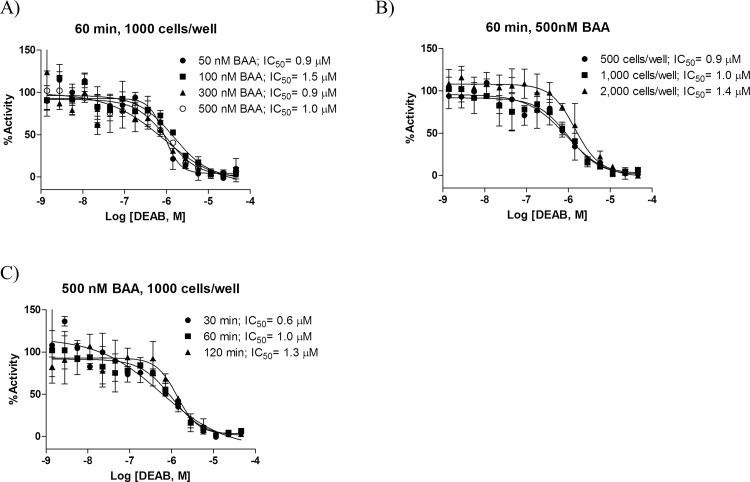
Fig 2. Assay miniaturization to 1,536-well format.
(A) DEAB dose response curves of 1,000 MIA PaCa-2 cells/well incubated with the indicated concentration of BAAA substrate for 60 min. (B) DEAB dose response curves of indicated number of MIA PaCa-2 cells/well incubated with 500 nM of BAAA substrate for 60 min. (C) DEAB dose response curves of 1,000 MIA PaCa-2 cells/well incubated with the indicated concentration of BAAA substrate for 60 min. Data are represented as mean +/- SD, n = 3, and normalized to DMSO (100% activity) and 4.6 μM DEAB (0% activity).

