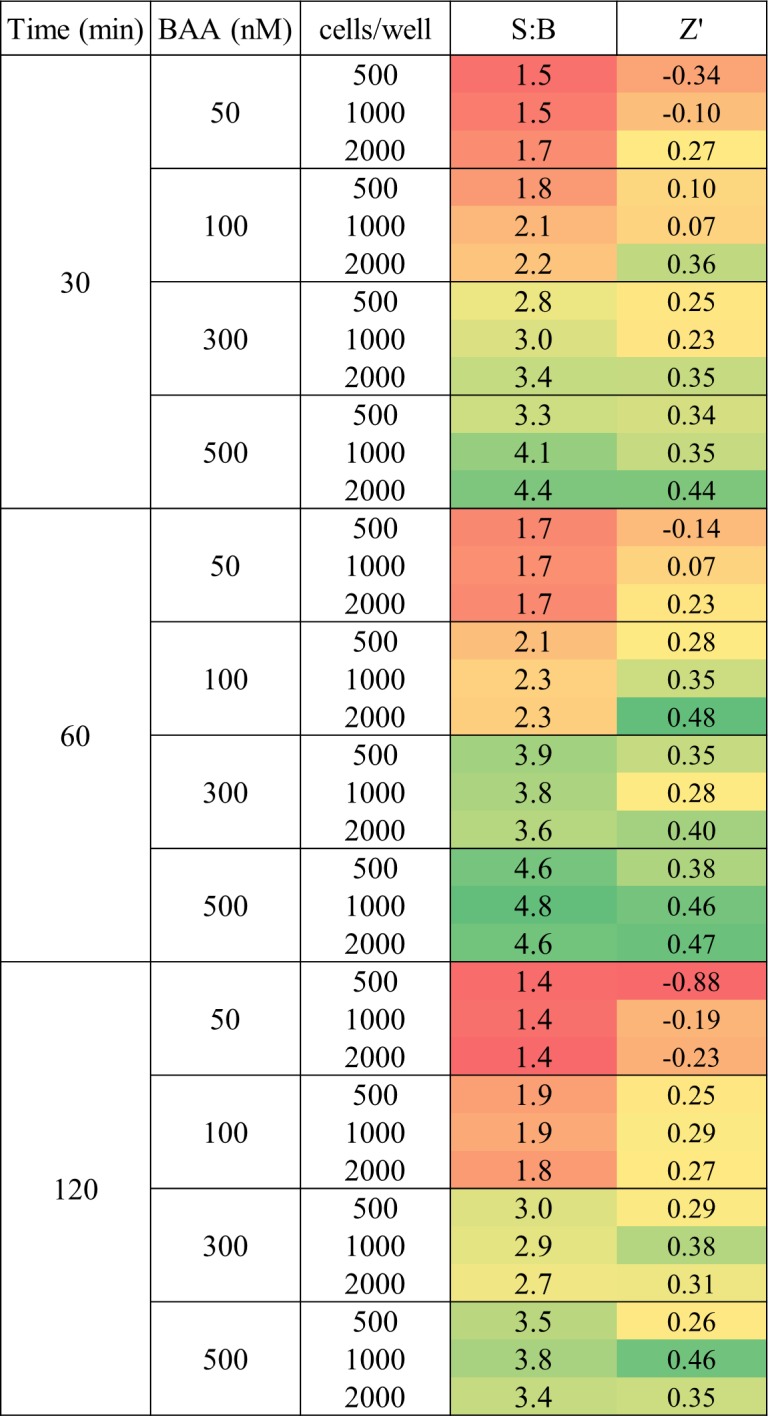
Fig 3. Assay optimization.

S:B and Z’ factor heat map according to variation in assay parameters. Green represents best assay conditions. Parameters were calculated using signal from control DMSO wells and inhibitor DEAB (4.6 μM final) wells with n = 32.
