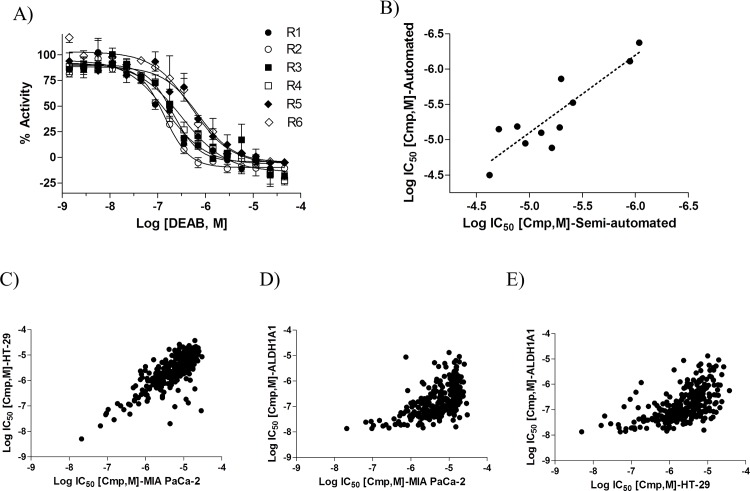
Fig 4. Assay automation.
(A) DEAB dose response curves of 1,000 cells/well MIA PaCa-2 cells incubated with 500 nM of BAAA substrate for 30 min. R1 to R4 represent four different independent replicates of the fully automated assay. R5 and R6 represent two different independent replicates of the semi-automated assay. Data is represented as mean +/- SD, n = 2. (B) Semi- and automated cellular BAA intensity measurements provide similar IC50 values for active compounds. Correlation plot of Log IC50 values of 11 active compounds in the semi-automated (x-axis) and automated (y-axis) assays. Inactive compounds are not included. (C) Correlation plot of Log IC50 values of 288 active compounds in MIA-PaCa-2 (x-axis) and HT-29 (y-axis) cells. Inactive compounds are not included. (D, E) Correlation plot of Log IC50 values for 288 active compounds in enzymatic ALDH1A1 assay (y-axis) and ALDEFLUOR assay (x-axis) in MIA-PaCa-2 (D) and HT-29 (E) cells. Inactive compounds are not included.

