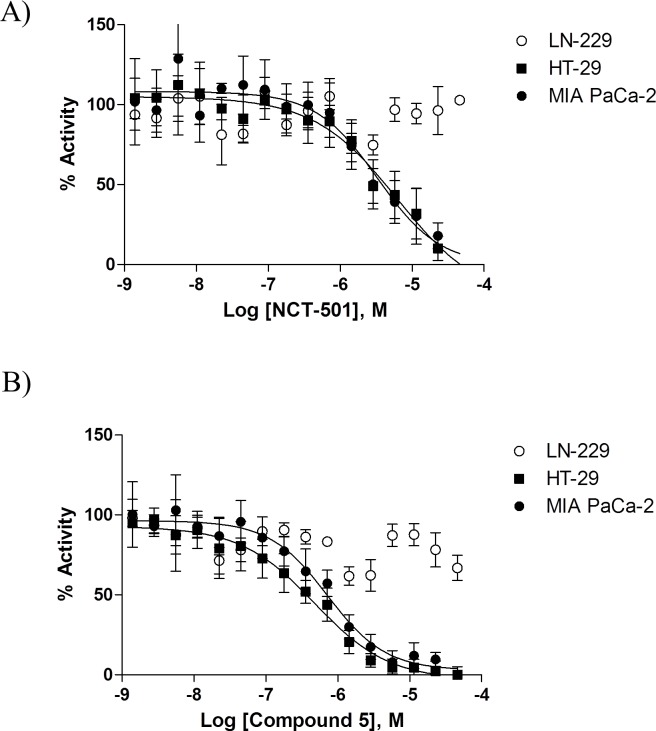
Fig 5. Differential ALDH-expressing patterns allow the detection of specific ALDH1A1 inhibitors.
Dose response curves of ALDH1A1-specific inhibitors NCT-501 (A) and Compound 5 (B) in MIA PaCa-2 and HT-29 (ALDH1A1-positive cells) vs. LN-229 (ALDH1A1-negative cells). The IC50 for NCT-501 and Compound 5 is 6.26 and 0.71 μM in MIAPaCa2 cells and 3.3 and 0.47 μM in HT-29 cells. Data are represented as mean +/- SD, n = 4.

