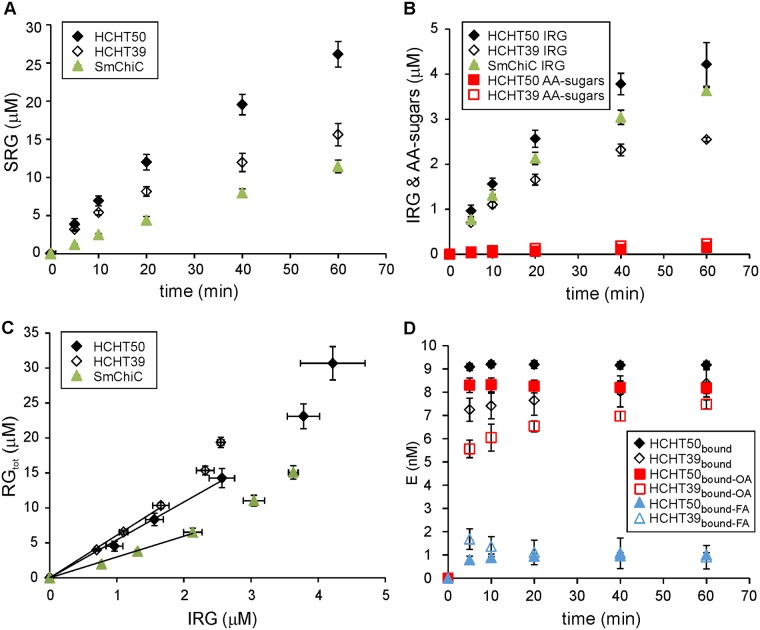
Fig 3. Processivity and probability of endo initiation of HCHTs.
AA-α-chitin (1 mg/mL) or reduced α-chitin (1 mg/mL) were hydrolyzed with HCHT50, HCHT39 (10 nM) or SmChiC (1 nM) at 37°C. (A) The release of soluble reducing groups (SRGs). Shown are the combined results with AA-α-chitin and reduced α-chitin. Error bars are from six independent experiments, three made with AA-α-chitin and three with reduced α-chitin as substrate. (B) The release of AA-labelled sugars from AA-α-chitin and the formation of insoluble reducing groups (IRG) on reduced α-chitin under otherwise identical conditions. (C) Data of the hydrolysis of reduced α-chitin from panels (A) and (B) plotted in the coordinates of total reducing groups (RGtot = IRG + SRG) versus IRG. The solid lines represent the best fit of linear regression (only the data points shown within the solid lines were included in linear regression analysis). The slope of the solid line from linear regression equals to apparent processivity, Papp. (D) Discrimination between different populations of HCHT bound to α-chitin. The total concentration of HCHT was 10 nM and that of α-chitin was 1 mg/mL. The concentration of total bound HCHT ([HCHT]bound) was found as a difference between the total concentration of the enzyme and the concentration of the enzyme free in solution. The concentration of HCHT with free active site was measured by following the MU-NAG2 hydrolyzing activity of HCHT in the presence of α-chitin. The concentration of bound HCHT with active site occupied by chitin ([HCHT] bound OA) was found as a difference between the total concentration of the enzyme and that with free active site. The concentration of bound HCHT with free active site ([HCHT] bound FA) was found as a difference between the [HCHT]bound and [HCHT] bound OA. Error bars show standard deviations and are from three independent experiments.

