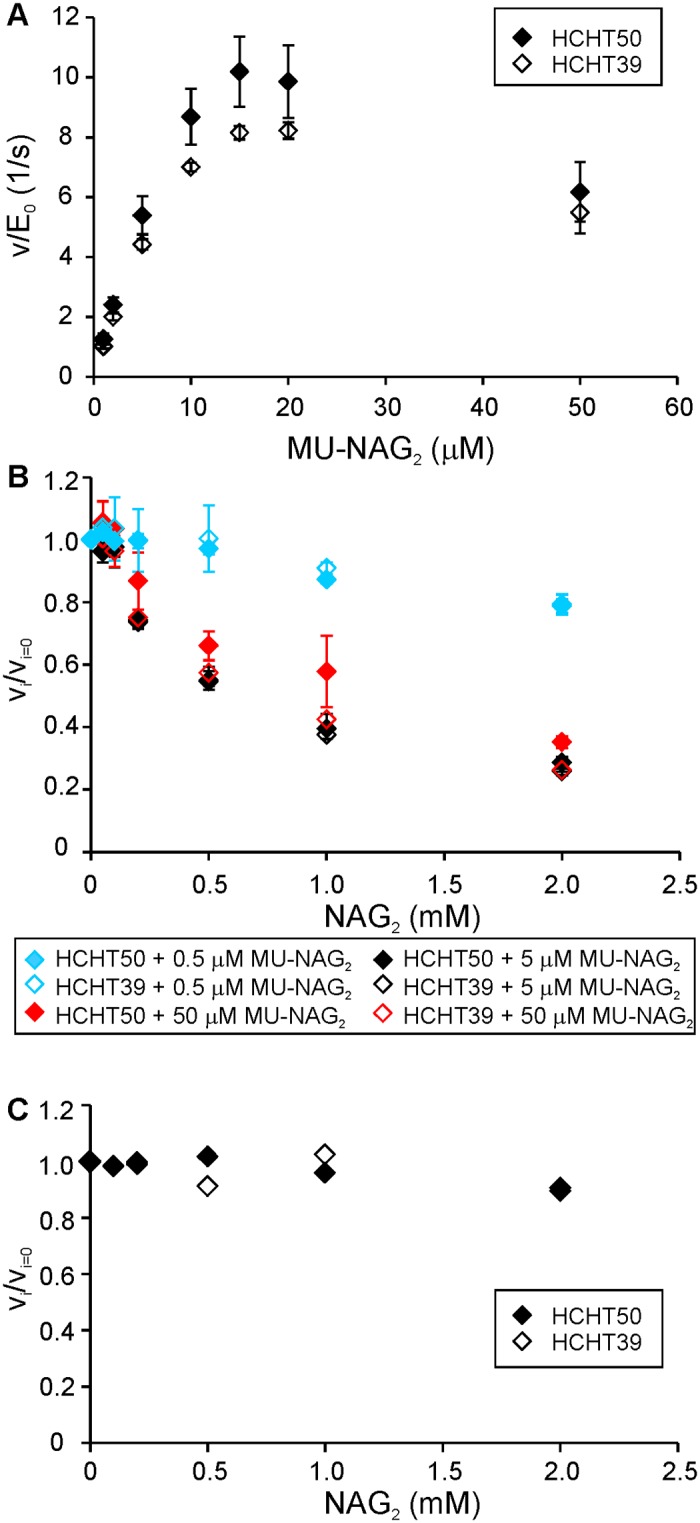
Fig 5. NAG2 inhibition of HCHT.

(A) Activity of HCHT on MU-NAG2 substrate as a function of substrate concentration. (B) NAG2 inhibition of HCHT on MU-NAG2 substrate measured at 3 different substrate concentrations—0.5 μM, 5 μM or 50 μM. (C) NAG2 inhibition of HCHT on 14C-CNW substrate (1.0 g/L). vi and vi = 0 stand for the rates measured in the presence and absence of inhibitor, respectively. Error bars show standard deviations and are from three independent experiments.
