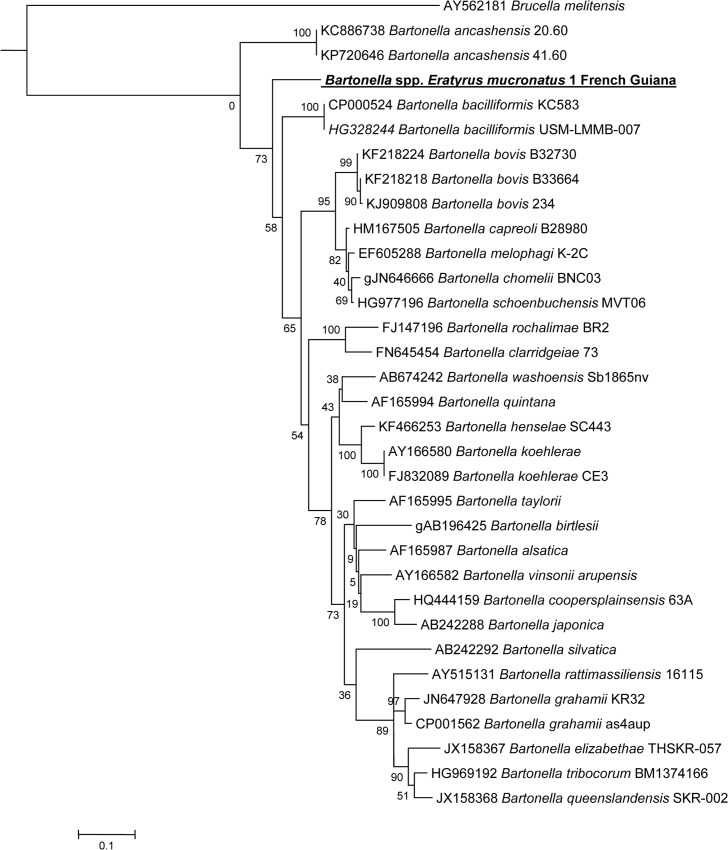
Fig 3. A consensus phylogenetic tree showing the relationships of the studied species of Bartonella species based on a portion of rpoB gene sequence comparison.
GenBank accession numbers (or the only genome accession number) are indicated when the sequences initially originated from Genbank. The sequences were aligned using ClustalW, and phylogenetic inferences were obtained using Bayesian phylogenetic analysis with TOPALi 2.5 software (Biomathematics and Statistics Scotland, Edinburgh, UK) within the integrated Maximum Likelihood application using the TrN + I + Г model. Numbers at the nodes are percentages of bootstrap values obtained by repeating the analysis 100 times to generate a majority consensus tree. Bootstrap values below 80 were deleted from the final tree. The final set includes 756 base pairs. The new Bartonella sequence described in the present study is written in red.

