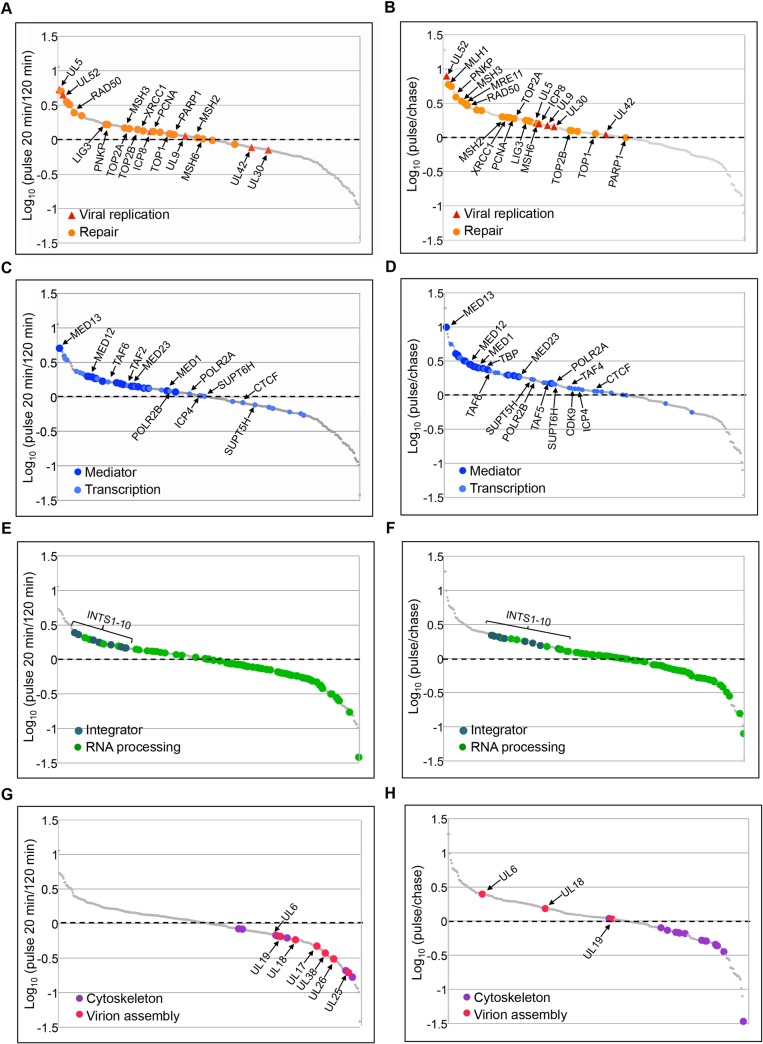
Fig 3. Pulse and Pulse Chase Analysis of Viral Replication Forks Reveals Interaction Dynamics Between Nascent Viral DNA and Associated Proteins.
Relative fork associated protein levels were compared between pulse labeled replication forks (20 min) and replicated genomes (120 min) (A, C, E, G) and between pulse labeled (pulse) and chased (chase) replication forks (B, D, F, H). Viral replication and cellular repair proteins (A, B), transcription factors (C, D), RNA processing factors (E, F), and cytoskeletal and virion assembly proteins (G, H) are highlighted in individual graphs. Gene names are indicated for corresponding proteins. See also S2 Fig and S1 Table.

