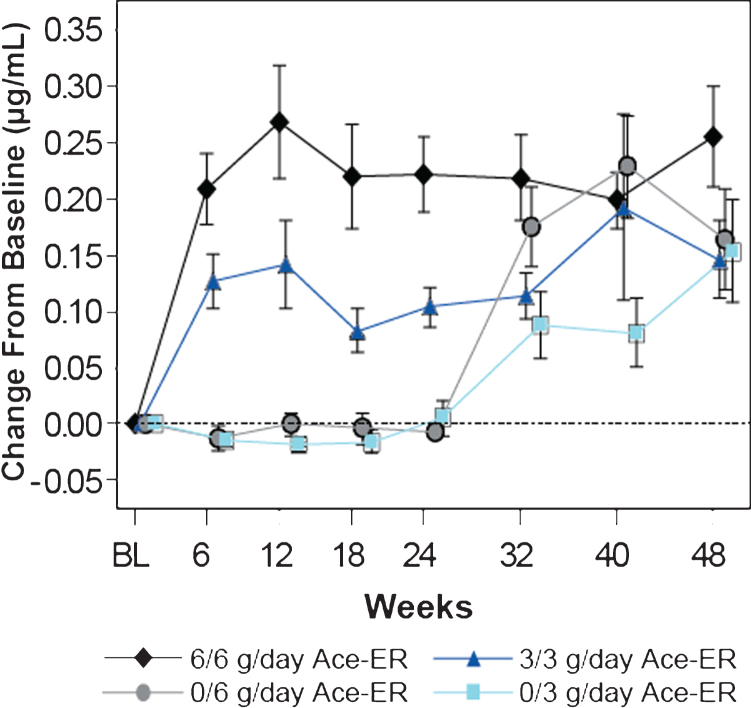
Fig.2.
Dose-dependent Increases in Mean (±SE) Free SA Levels in Serum. Serum free SA levels were measured by LS/MS/MS and are presented as the mean change (±SE) from baseline in μg/mL. Dose dependent increases in SA were observed over time. At 24 weeks, the placebo groups crossed over to the 6 g/day and 3 g/day groups (designated as 0/6 g/day and 0/3 g/day, respectively).

