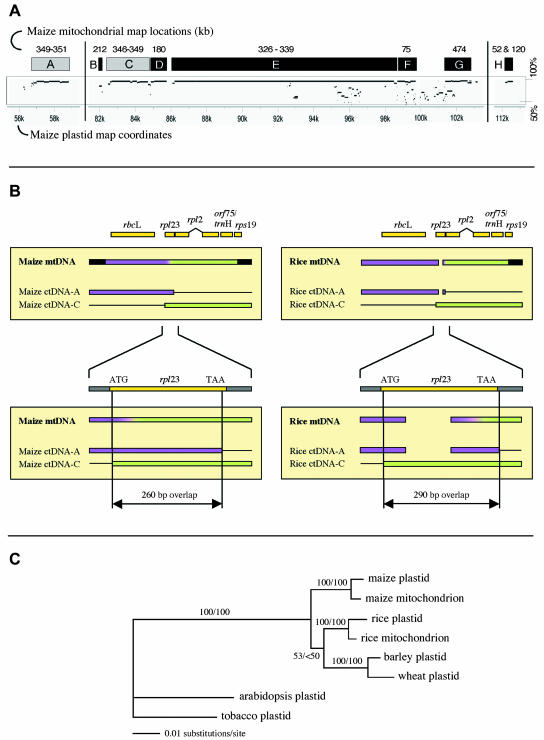
Figure 2.
Three regions of plastid DNA found in the mitochondrial genome. A, Locations of plastid sequences in the plastid and mitochondrial genomes. Lower axis is plastid genome coordinates; the plastid IR extends from 82 kb to 105 kb. Boxes indicate regions of ctDNA present in the NB mtDNA; numbers above them are their coordinates (kb) in the mitochondrial genome. Lighter boxes are the components of the 4.1-kb region. Below the boxes are the MultiPip representations of sequence similarity between the maize plastid genome and the maize mitochondrial genome. Vertical scale is 50% to 100%. B, Alignment of sequences relevant to the 4.1-kb segment of ctDNA present in the maize and rice mitochondrial genomes. Purple and green colored boxes indicate regions A and C in section A that recombined to form the 4.1-kb segment. Lower alignment is an enlargement of the region of overlap between the A and C regions, showing their relationship to rpl23. Purple-to-green gradients indicate areas where recombination occurred, but where definitive assignment to A or C is not possible. C, Parsimony phylogenetic tree for the 4.1-kb plastid sequence in the mitochondrion. Depicted branch lengths for Arabidopsis and tobacco are substantially shorter than their actual lengths because highly divergent and thus unalignable sequences were deleted from the data set. Parsimony/maximum likelihood bootstrap values for 100 replicates are indicated on branches.

