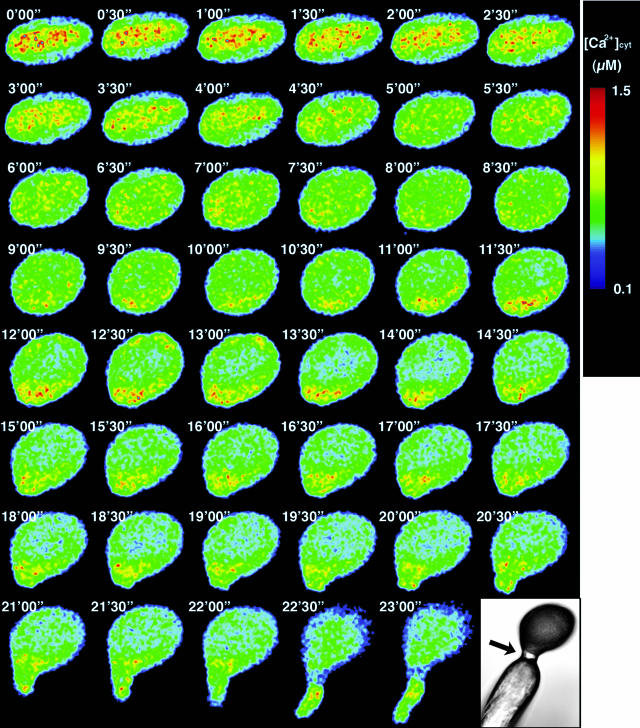
Figure 4.
Ca2+ dynamics in the pollen grain during in vivo pollination. Monitoring was performed under dry conditions. [Ca2+]cyt was high at the center of the pollen grain before hydration. [Ca2+]cyt was increased at the potential germination site during hydration (9′30″–15′30″). The accumulation continued until germination (approximately 22′30″).

