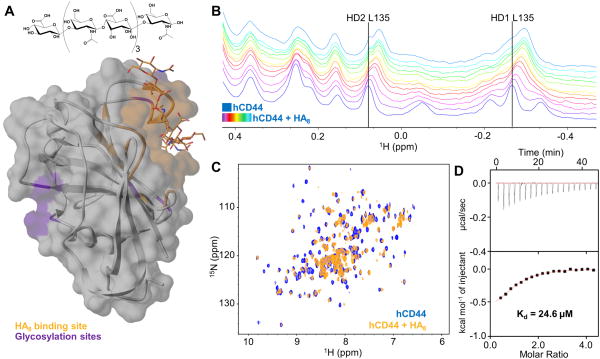
Figure 1. Biophysical validation of HA8.
(A) Semitransparent molecular surface representation of the homology model of hCD44 built with SWISS-MODEL [22a] [22b] [22c] [22d] using the structure of mCD44 in complex with HA8 (PDB 2JCR) as template. HA8 (chemical structure is reported in the upper panel) and the HA binding pocket are colored in orange. The glycosylation sites are highlighted in purple.
(B) 1D 1H-aliphatic spectra of 20 μM hCD44(21–178). The apo spectrum is blue while the spectra recorded in presence of increasing concentrations of HA8 (starting from 20 μM to 220 μM) are in purple to light-blue.
(C) 2D [1H,15N]-sofast-HMQC of 20 μM hCD44(21–178) in the apo form (blue) and with a 11-fold molar excess of HA8 (orange).
(D) Isothermal Titration Calorimetry (ITC) for hCD44(21–178) titrated with HA8. The Kd obtained is 24.6 μM. The relatively low enthalpy of binding (ΔH= −0.7 Kcal/mol) is justified by the weak binding.

