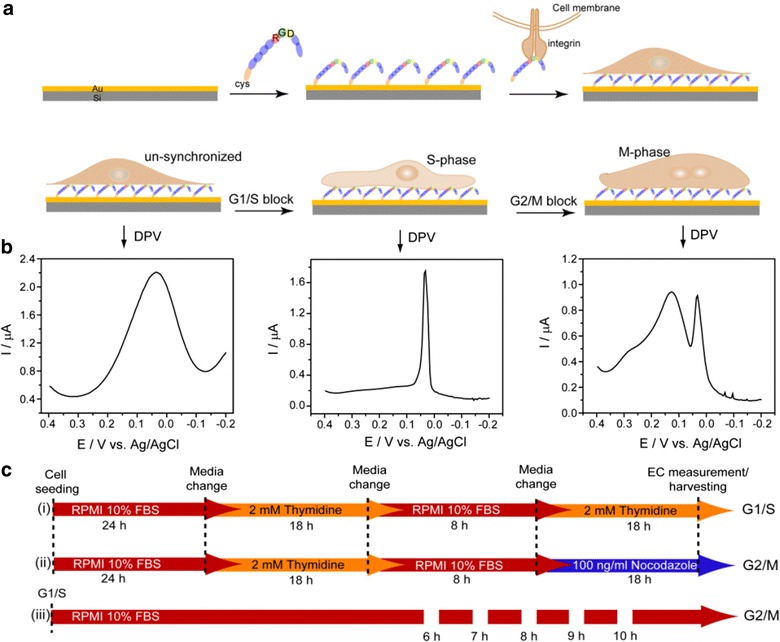
Fig. 12.

Schematics of experimental setup: a fabrication of RGD-MAP-C based-cell chip used throughout the experiments, b synchronized G1/S-phase (middle), G2/M-phase (right), and unsynchronized (left) cells with their respective DPV signals (down arrows indicate respective signals), and c time course of cell treatment for synchronization in G1/S-phase (i) and G2/M-phase (ii), and gradual progression of G1/S cells towards G2/M-phase following time-dependent release from G1/S block (iii).
Figure adapted with permission from Ref. [18]. Copyright (2011) American Chemical Society
