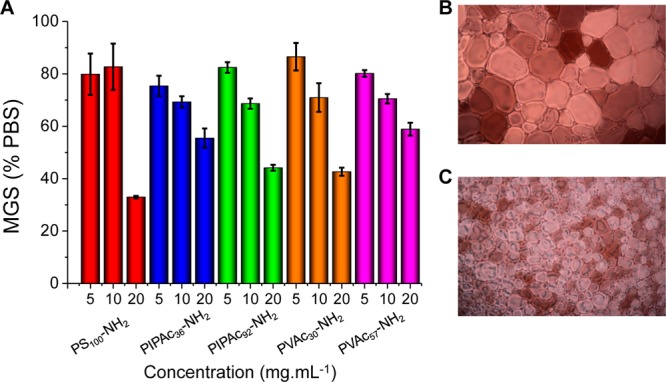
Figure 4.

IRI activity of amino side chain polyampholytes with various backbones. (A) IRI activity; (B) Cryo-micrograph of PBS buffer control; (C) Cryo-micrograph of PS100-NH2 at 20 mg·mL–1. MGS = mean grain size reported as an area. Averages are from a minimum of three repeats and error bars are the standard deviation. Images are 660 μm wide.
