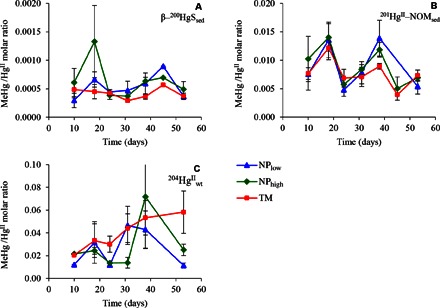
Fig. 1. MeHg net formation in sediment from three different HgII tracers in response to experimental treatments.

The graphs display average MeHg/HgII molar ratios ± SE (n = 3 to 9) determined in mesocosm sediments at different times in response to each of the three experimental treatments: low nutrient input (NPlow, blue triangles), high nutrient input (NPhigh, green diamonds), and terrestrial NOM input (TM, red squares). Each panel displays the net methylation for the specific HgII isotope tracers added to the mesocosms. (A) Metacinnabar added to the sediment (β-200HgSsed), (B) organic matter Hg complex added to the sediment (201HgII-NOMsed), and (C) HgII added to the water column (204HgIIwt). The data for the NPlow treatment were reproduced with permission from Jonsson et al. (10).
