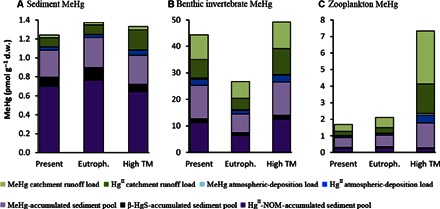
Fig. 3. Modeled MeHg concentrations in sediment and biota for different ecosystem scenarios.

Modeled MeHg concentration (table S4) in (A) sediment, (B) benthic invertebrates, and (C) zooplankton. The contributions from individual geochemical HgII and MeHg pools to the total MeHg concentrations are indicated by different colors. The modeling conditions are relevant to the coastal zone of the northern Bothnian Sea under present conditions (Present), for an eutrophication scenario (Eutroph.), and for an enhanced loading of terrestrial matter (High TM), as projected in climate change scenario Representative Concentration Pathway 8.5 (RCP8.5) for large parts of the world.
