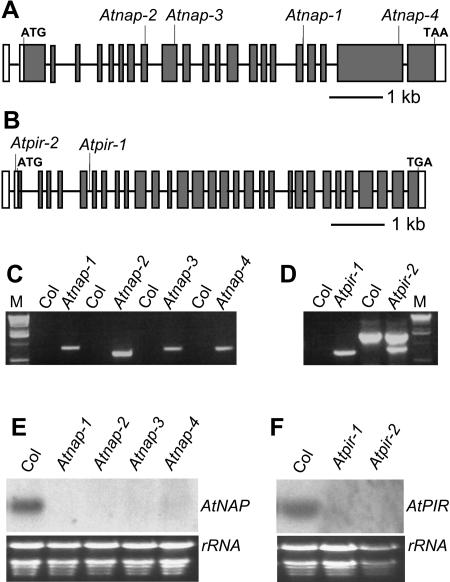
Figure 2.
Molecular characterization of Atnap and Atpir mutants. A, Location of T-DNA insertions in Atnap-1, Atnap-2, Atnap-3, and Atnap-4 mutant lines are shown on the exon map of the AtNAP gene. The position of exons and introns are indicated by black rectangles and lines, respectively. B, Location of the T-DNA insertions in Atpir-1 and Atpir-2 mutant lines are shown on the exon map of AtPIR gene. The position of exons and introns are indicated by black rectangles and lines, respectively. The untranslated regions are shown by white rectangles. C, PCR identification of T-DNA insertion in Atnap mutants with T-DNA specific primers and flanking primers. Atnap lines yielded PCR products and Col wild-type lines did not amplify. M, One-kilobase DNA ladder. D, PCR identification of T-DNA insertion in Atpir mutants with T-DNA specific primers and flanking primers. Compared with Col wild type, Atpir mutant lines had specific PCR products. M, One-kilobase DNA ladder. E, Northern-blot analysis of AtNAP transcript levels in Col wild-type, Atnap-1, Atnap-2, Atnap-3, and Atnap-4 seedlings. F, Northern-blot analysis of AtPIR transcript levels in wild-type, Atpir-1, and Atpir-2 seedlings.

