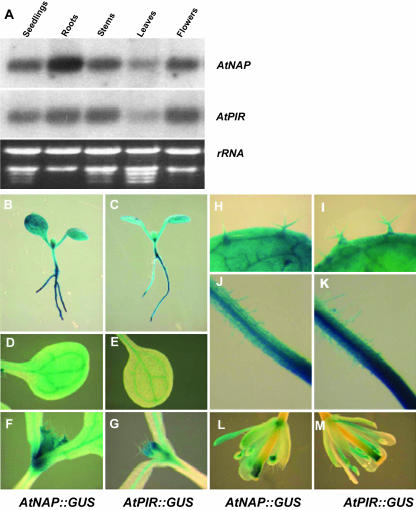
Figure 7.
Expression patterns of AtNAP and AtPIR genes. A, Northern-blot analysis of AtNAP and AtPIR gene expression. Total RNA was isolated from seedlings, roots, stems, leaves, and flowers. B, GUS activity in AtNAP∷GUS seedlings. C, GUS activity in AtPIR∷GUS seedlings. D, GUS activity in AtNAP∷GUS cotyledons. E, GUS activity in AtPIR∷GUS cotyledons. F, GUS activity in AtNAP∷GUS shoot apex. G, GUS activity in AtPIR∷GUS shoot apex. H, GUS activity in AtNAP∷GUS line in trichomes. I, GUS activity in AtPIR∷GUS line in trichomes. J, GUS activity in AtNAP∷GUS line in root hairs. K, GUS activity in AtPIR∷GUS line in root hairs. L, GUS activity in AtNAP∷GUS line in flowers. M, GUS activity in AtPIR∷GUS line in flowers.

