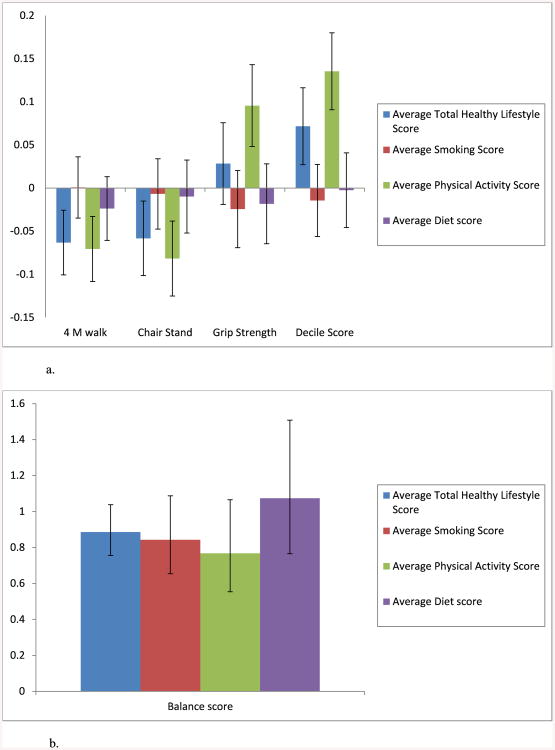
Figure 1.
a. Multivariable prospectivea associations (standardized betas) between continuous physical performance measures and 1) total Healthy Lifestyle Scoreb and 2) each healthy lifestyle behaviorb adjusted for the other behaviors.
a. Healthy lifestyle behaviors measured at least 4 years prior to physical performance measures
b. Total healthy lifestyle score and each component score are treated as a continuous average over all available visits and ranges from 0-6 for total score and 0 to 2 for components scores; results are presented as the average increase in standard deviation of each outcome for one standard deviation of the total healthy lifestyle score or each of the behavior component scores.
Note: Results are from two separate linear regression models: one included the total healthy lifestyle score; the other included all three behavior component scores. Confounders included: for all models: age, race, site, BMI, overall self-rated health, and arthritis; for 4 m walk: number of comorbidities and foot covering; for 40 ft walk: marital status, CES-D, diabetes, type of menopause, alcohol use, and floor surface; for grip strength: difficulty paying for basics, dominant hand and dynamometer setting; for chair stand: difficulty paying for basics, foot covering; for decile score: number of comorbidities, difficulty paying for basics, and education;
b. Multivariable prospectivea risk (odds ratios) of balance limitations associated with 1) total Healthy Lifestyle Scoreb and 2) each healthy lifestyle behaviorb adjusted for other behaviors.
a. Healthy lifestyle behaviors measured at least 4 years prior to physical performance measures
b. Total healthy lifestyle score and each component score are treated as a continuous average over all available visits and range from 0-6 for the total healthy lifestyle score and 0 to 2 for component scores; results are presented as the odds ratio of any balance limitations for each increase in one point of the average score.
Note: Results are from two separate logistic regression models: one included the total healthy lifestyle score; the other included all three behavior component scores. Confounders included age, race, site, BMI, overall self-rated health, and arthritis, CES-D, foot covering, alcohol use and hormone use

