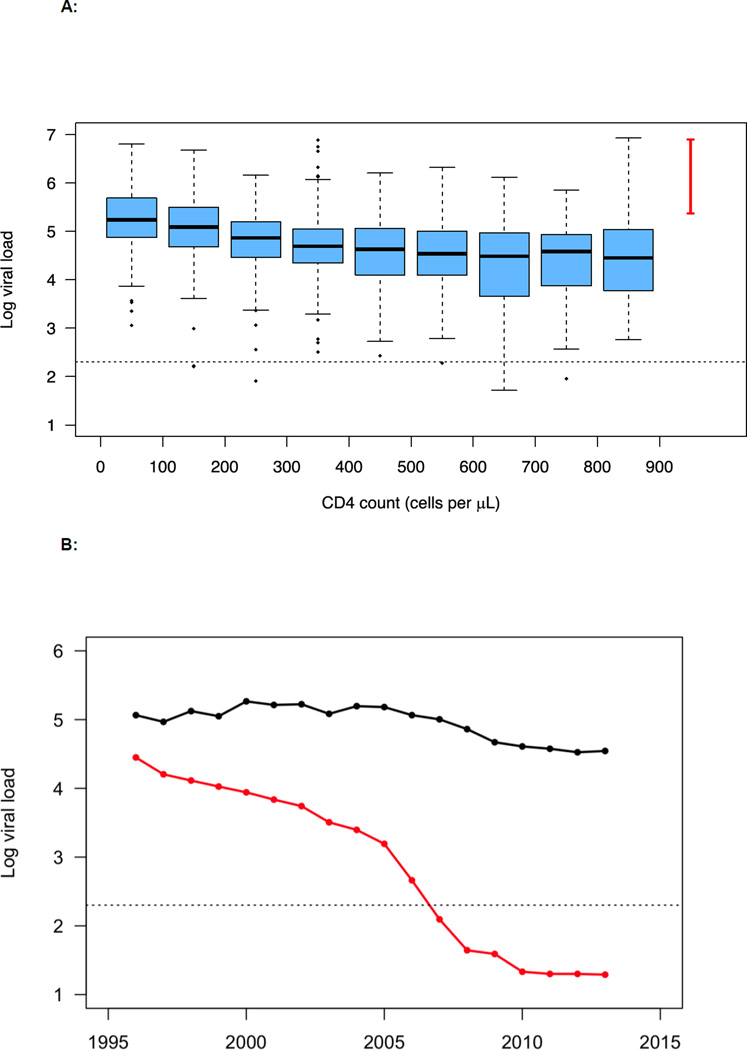
Figure 1.
A: CD4-stratified viral load distributions are shown plotted on a logarithmic scale, log10 copies per mL. Distributions were constructed using data collected from 1,059 treatment-naïve HIV-infected MSM who participated in the Danish HIV Cohort Study. The horizontal line in each box plot represents the median, black dots show outliers, the dotted line denotes viral suppression (<200 copies per mL), and the red line shows the range of viral load estimates for acute infection.
B: Temporal trends in the mean (black) and median (red) values of the population viral load (PVL) as the Danish HIV epidemic in MSM was driven to the brink of elimination; PVL is shown on a logarithmic scale, log10 copies per mL. Data are from the DHCS; the dotted line denotes viral suppression (<200 copies per mL).

