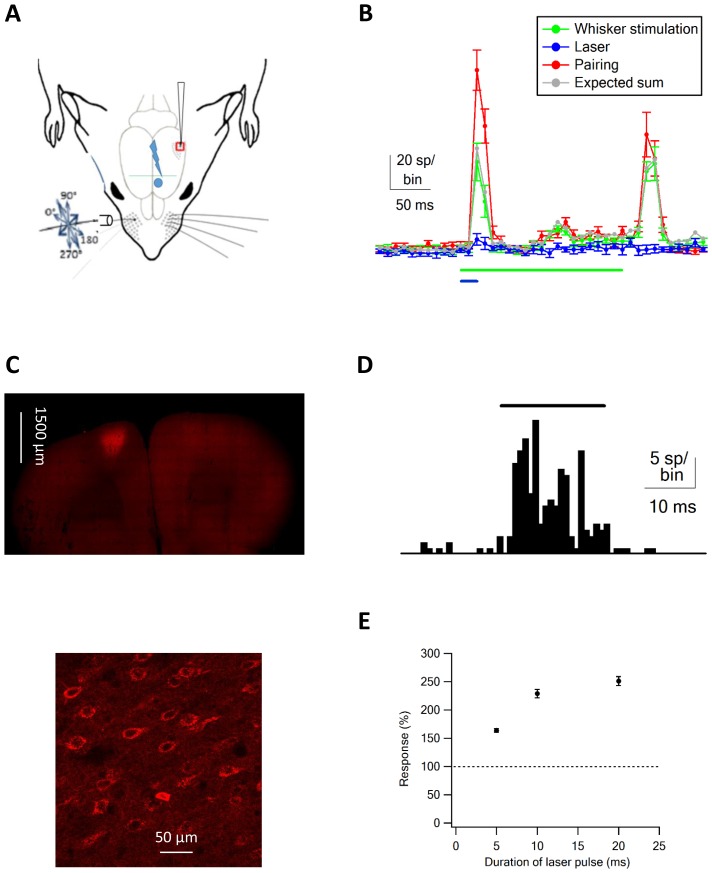
Figure 1. Optogenetic vM1 activation and passive ramp and hold vibrissa deflection.
(A) Scheme of the experimental design with the recording electrode in vS1, optogenetic stimulation of vM1 and ramp and hold passive vibrissa deflection. (B) Peri-stimulus histograms (PSTH, mean ± SEM) recorded from a vS1 neuron during isolated vM1 optogenetic stimulation (blue), isolated passive vibrissa deflection (green), and paired vM1-vibrissa stimulation (red). In addition, the expected linear sum of the solitary vM1 stimulation and vibrissa deflection is shown (gray). (C) Fluorescence images at different magnifications of neurons co-expressing ChR2 and mCherry. (D) PSTH recorded from a vM1 neuron during optogenetic stimulation (473 nm laser pulse). (E) Average (mean ± SEM) responses recorded in vS1 neurons during optogenetic stimulation of vM1 with laser pulse duration (147 neurons in four rats). In each neurons, the spike count responses during optohgenetic stimulation were presented as percent of the spike count during the pre-stimulus control value. Later, the responses were averaged over the different neurons.


