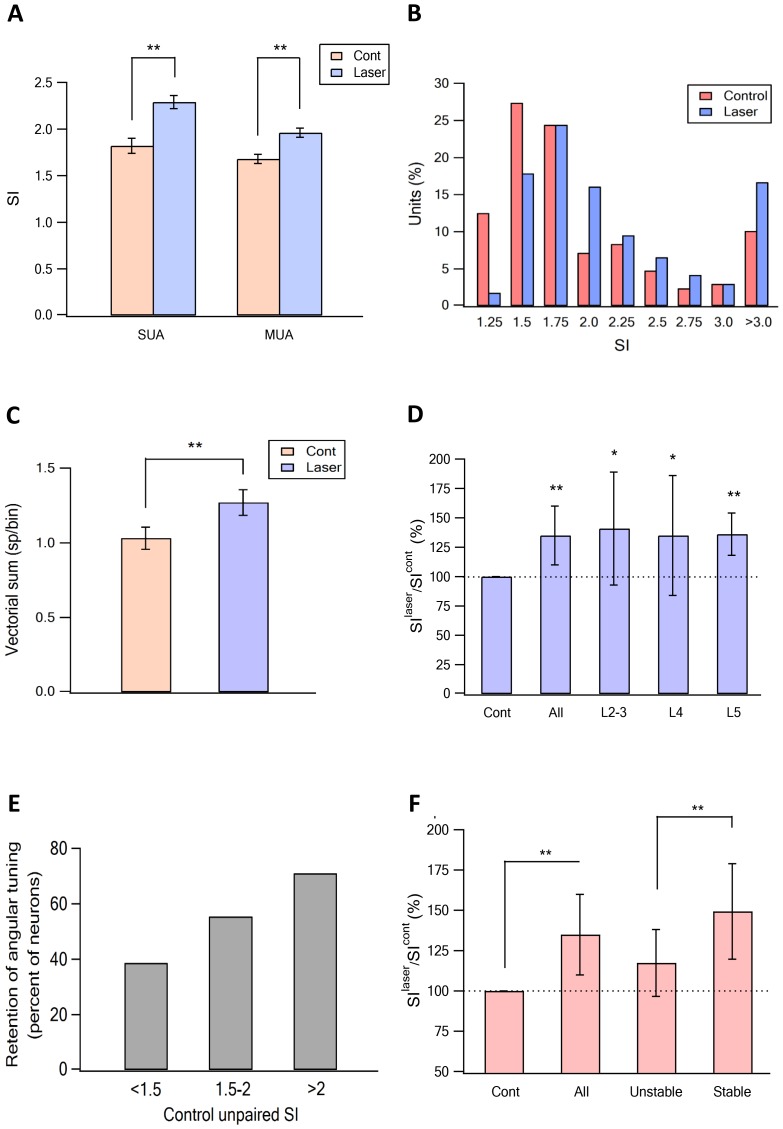
Figure 6. Sharpening of the angular tuning of vS1 by paired vM1 activation: averaged results.
(A) The average (mean ± SEM) ratio between the SI calculated for the preferred angular direction for isolated vibrissa deflection (red) and paired vibrissa deflection with vM1 optogenetic activation (blue). The results are presented for single- (SUA) and multi-unit (MUA) analysis. The results are shown for all neurons examine (304 neurons from 11 rats). Note the significant increase in the SI following pairing with vM1 activation for moth SUA and MUA. (B) The SI magnitude histogram of unit for isolated for isolated vibrissa deflection (red) and paired vibrissa deflection with vM1 optogenetic activation (blue). Note that paired vM1 optogenetic stimulation resulted a right shift of the histogram. (C) The effect of vM1 optogenetic activation on the average amplitude (mean ± SEM) of the vector sum. Vector sum analysis was performed on the same data set presented in panels A and B (204 neurons from 11 rats). **p<0.01. (D) The average (mean ± SEM) ratio between the SI calculated for isolated vibrissa deflection and paired vibrissa deflection with vM1 optogenetic activation. The results are shown for all neurons examine, and for the different putative cortical layers (25.7% putative layer 2–3 neurons, 20% putative layer 4 neurons and 54.3% putative layer five neurons). *p<0.05, **p<0.01. In cases the SI for isolated vibrissa deflections were compared with paired vibrissa deflections and vM1 optogenetic activation using the paired student's t-test. (E) Percent of neurons that retained the same SI with and without vM1 optogenetic activation as a function of the control SI value (SI < 1.5, SI = 1.5–2 and SI > 2). (F) The average (mean ± SEM) ratio between the SI value recorded without (SIcont) and with (SIlaser) vM1 optogenetic activation in all recorded neurons and in neurons which retained the preferred angle with and without optogenetic activation (stable), and in neurons that changed their preferred angle after vM1 activation (unstable). **p<0.01.


