. 2017 Jan 13;6:e21354. doi: 10.7554/eLife.21354

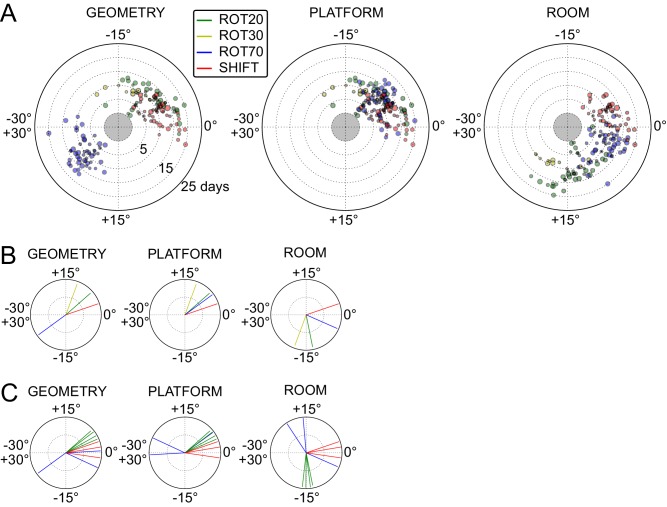
Figure 5. Systematic biases in frame prevalence and anchoring by rat and manipulation.

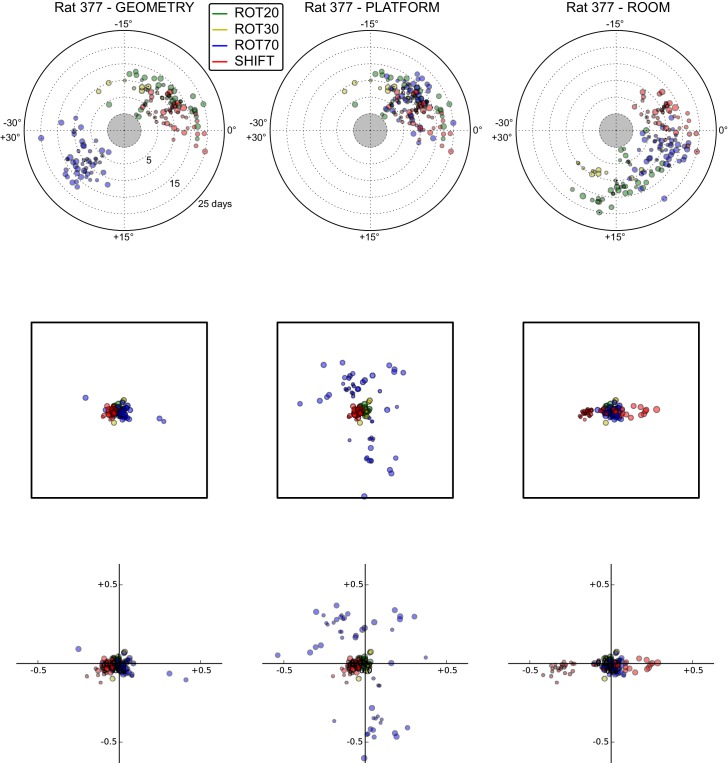
(A) Rotation of each grid recorded from rat 377, organized by manipulation type (color), relative to the platform geometric reference frame (left), actual platform (center), and room (right). Perfect control by a reference frame is indicated by a 0° angle, whereas positive angles correspond to a CW rotational dissociation from the frame (i.e. the direction of the experimental rotations of the platforms). The radial position indicates the number of recording days since the rat’s first experience of a non-STD session (external edge of the central gray circle). Dot size is proportional to the scale of the grid measured in STD. Note the general consistency of responses across days and the segregation of response angles by manipulation type (color). These plots ignore the phase component of the grid response, which dramatically reveals additional separation only in some animals/manipulations. Scatterplots for all seven rats are given in figure Figure 5—figure supplements 17, together with scatter plots for phase shift data. (B) Mean unit vectors of the rotation distributions calculated for each manipulation (color) from the data in A. Mean vector lengths are measures of circular variance. All mean vectors are close to 1 (maximum), consistent with the tight distributions of angles for each manipulation type. (C) Mean vectors from all rats and manipulations as in B, restricted to the rat-manipulation datasets that comprised at least seven distinct recoding days. As in (B), all mean vectors are close to the maximum value of 1, showing that the individual rats’ responses to each manipulation were reproducible and stable across multiple days of recordings. See figure supplements 1-7 for more details for each rat.

DOI: http://dx.doi.org/10.7554/eLife.21354.010

Figure 5.

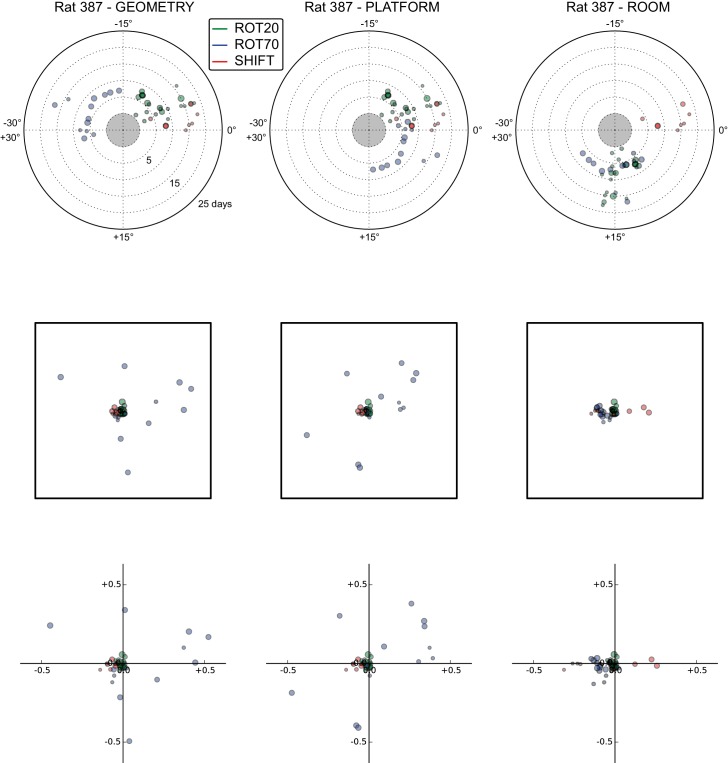
Figure 5—figure supplement 1. All grid rotations and phase shifts from rat 387.

Figure 5—figure supplement 1.

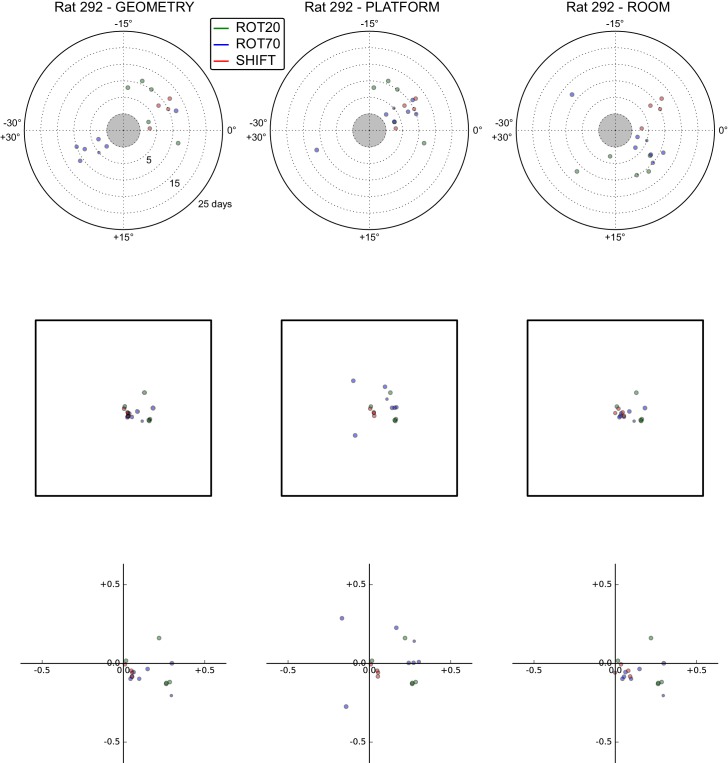
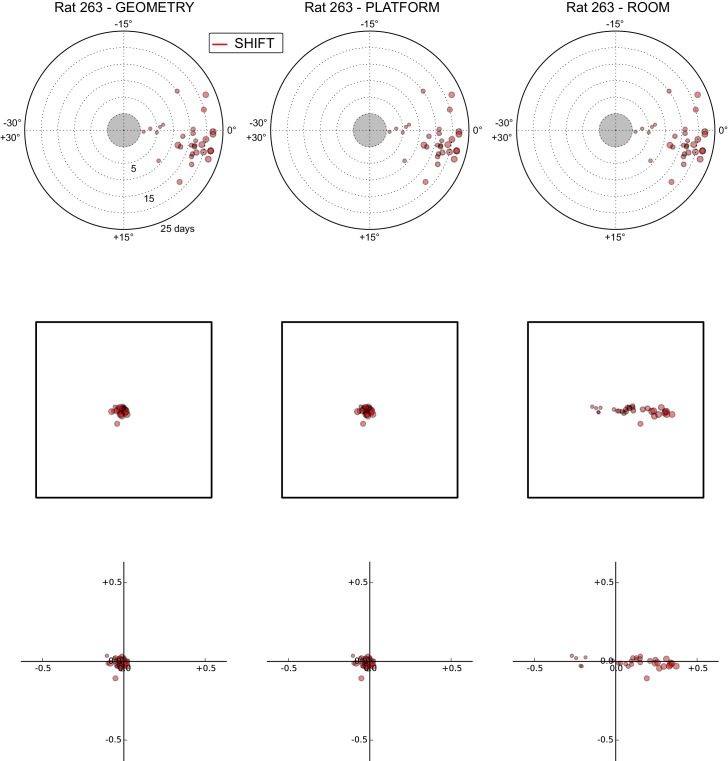
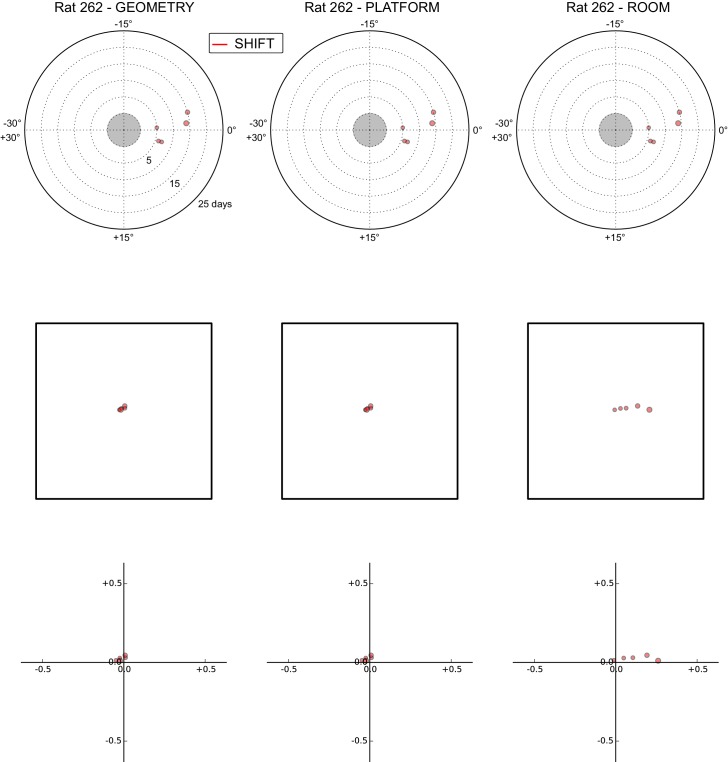
These plots display daily rotations and phase shifts for each grid relative to the three reference frames: platform geometry (left column), physical platform (central column), or room (right column). Manipulation types are color-coded and dot size is proportional to the scale of the grid measured in STD. Non-null rotations and phase shifts relative to any reference frame represent rotational and positional dissociations of the grid from the reference frame, respectively. The dominant reference frame in each manipulation is the one producing smaller rotations and/or phase shifts. (Top row) Rotation of each grid relative to the last performed STD session, illustrated as in Figure 5A. Rotational dissociation from platform geometry is calculated relative to the minimal rotation of the square that is symmetrically congruent to the performed physical platform rotation; it differs from the platform's physical rotation only in ROT70. (Middle row) Phase shifts for the same grids as in the top row, calculated under the assumption of the grid following the respective reference frame (see Figure 3E, and Materials and methods). An in-scale schematic of the platform (arbitrarily oriented as in the STD condition) is provided to aid visual evaluation of the shift magnitude. (Bottom row) Same as in the middle row but shifts are reported as a proportion of the individual grid period.
Figure 5—figure supplement 2. All grid rotations and phase shifts from rat 377.

Figure 5—figure supplement 2.

Data are illustrated as in Figure 5—figure supplement 1. Scatter plots in the top row are replicated from Figure 5A. The five grid cells recorded in ROT45 (see Figure 3—figure supplement 2) are not reported in these plots.
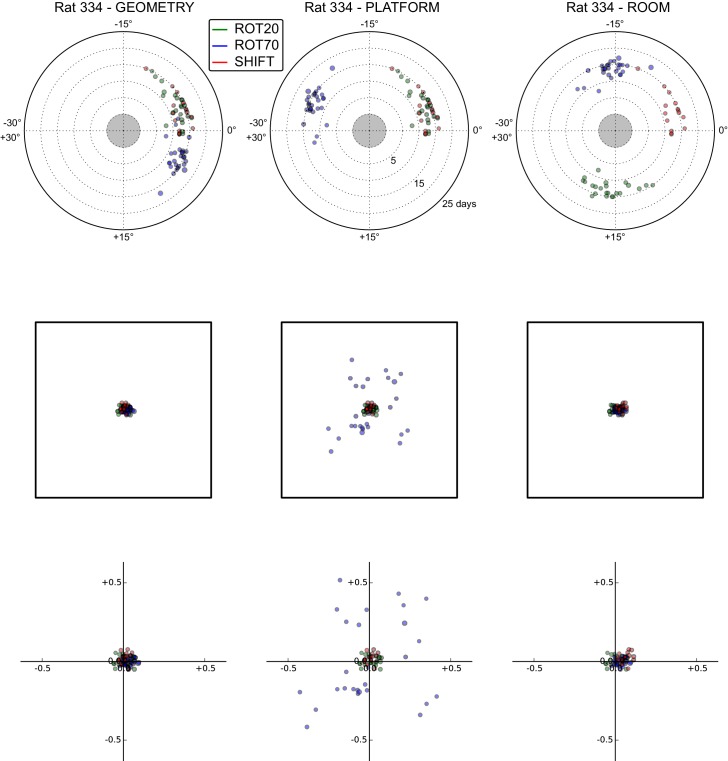
Figure 5—figure supplement 3. All grid rotations and phase shifts from rat 334.

Figure 5—figure supplement 3.

Data are illustrated as in Figure 5—figure supplement 1.
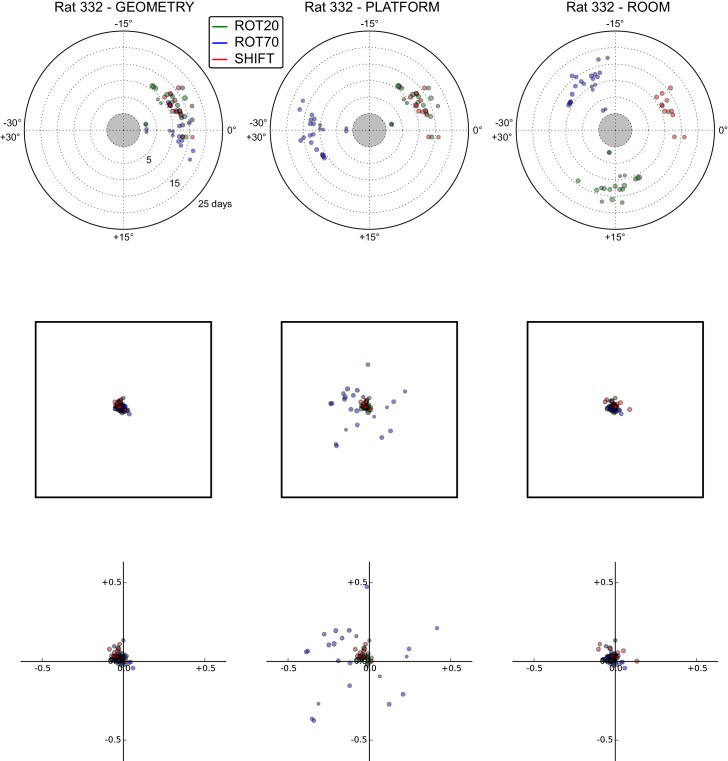
Figure 5—figure supplement 4. All grid rotations and phase shifts from rat 332.

Figure 5—figure supplement 4.

Data are illustrated as in Figure 5—figure supplement 1.
Figure 5—figure supplement 5. All grid rotations and phase shifts from rat 292.

Figure 5—figure supplement 5.

Data are illustrated as in Figure 5—figure supplement 1.
Figure 5—figure supplement 6. All grid rotations and phase shifts from rat 263.

Figure 5—figure supplement 6.

Data are illustrated as in Figure 5—figure supplement 1.
Figure 5—figure supplement 7. All grid rotations and phase shifts from rat 262.

Figure 5—figure supplement 7.

Data are illustrated as in Figure 5—figure supplement 1.