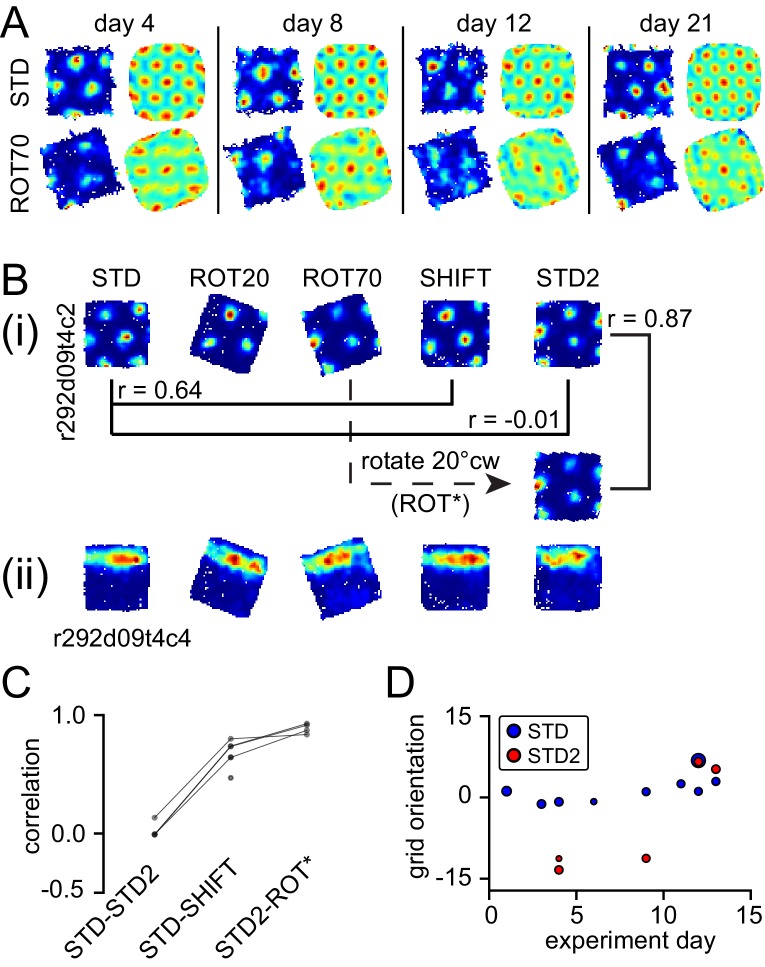
Figure 6. Neural correlates of cue conflict that are idiosyncratic but consistent within individual rats.
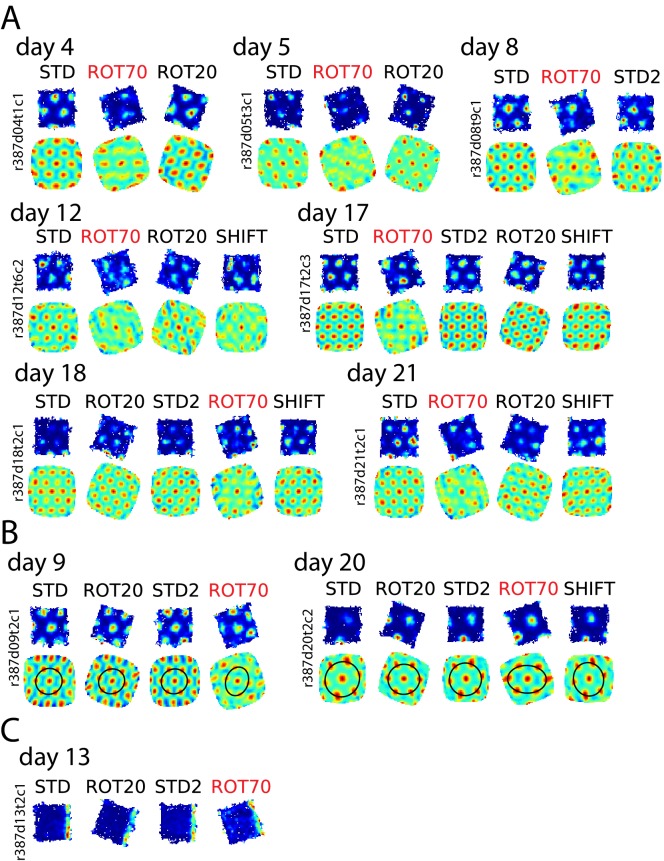
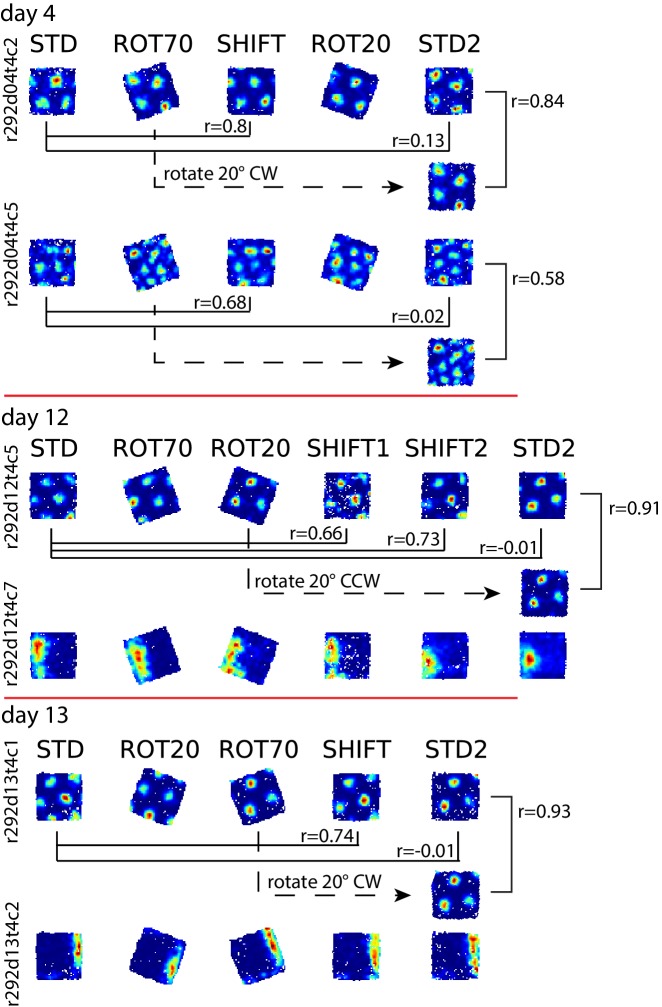
(A) Grid degradation. Rate maps and autocorrelograms of 4 grid cells recorded from four different tetrodes in rat 387 in both STD and ROT70 on four different days (including the first and last days in which grid cells were obtained in ROT70). The equilateral triangular structure, but not the multi-field nature, of the grid cells was dramatically reduced or entirely lost in ROT70. Rate maps for all sessions in which these cells were recorded and additional examples are given in figure supplement 1. (B) Grid realignment and dissociation from boundary cells. Rate maps for two units and all sessions of one experiment day, from rat 292. After varying amounts of realignment in the ROT20 and ROT70 conditions (i), the grid reverted back to its standard alignment relative to the platform boundaries in the SHIFT condition and shifted along with the platform (with a minor CCW rotation, as described in Figure 4B and G). However, in STD2, the grid did not maintain this standard alignment. Instead, the grid reverted to the same alignment relative to the platform boundaries that it had adopted in the ROT70 session. Pearson correlations between relevant maps quantify the poor overlap between STD and STD2 and the strong overlap between ROT70 and STD2 (after the ROT70 was rotated 20° CW). A simultaneously recorded boundary cell (ii) always fired along the upper platform boundary, dissociating from the realignment of the grid in ROT20, ROT70, and STD2 (re-illustrated as first example in Figure 7A). (Additional examples are given in Figure 6—figure supplement 2 and Figure 7A.) (C) Pearson correlations between rate maps from STD vs. STD2 (n = 4), STD vs. SHIFT (n = 6), and STD vs. the manipulation found to induce the new alignment in STD2 (n = 4), in a given day, for all grid cells and days in rat 292. Values referring to the same unit and day are linked. (D) Grid orientations in the standard sessions sampled over the course of 13 experiment days. Dot size is proportional to grid scale. Grid orientations in STD sessions (blue) are consistent across days in spite of the change of orientation experienced in STD2 sessions (red).


