. 2017 Jan 13;6:e21354. doi: 10.7554/eLife.21354

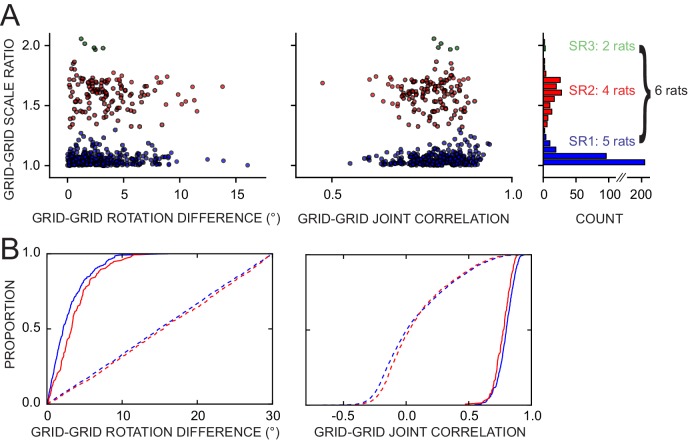
Figure 8. Response of simultaneously recorded grid cells.

(A) Difference in rotations and joint correlations for pairs of grid cells from six rats in all manipulations, by the pair’s grid scale ratio (SR): blue SR ≤ 1.3 (SR1); red: 1.3 < SR ≤ 1.9 (SR2); green: SR > 1.9 (SR3). Note that the scale-ratio clusters do not correspond to the absolute scales; rather, a scale ratio ~1.0 (blue dots) indicates two grids of the same scale (regardless of the absolute scale size) and a scale ratio ~1.6 indicates two grids from presumably adjacent modules (as defined by Stensola et al., 2012). The outliers in each scatterplot (rotation difference >10° on left, joint correlation <0.5 on right) were caused by six large-scale grids that participated in 11 pairs. Visual inspection of the rate maps of these six grids determined that poor spatial sampling of the peripheral vertices made these measurements ambiguous. (B) Cumulative density distributions for the SR1 and SR2 data in A (solid lines). For both measures, the two distributions were only slightly different from each other, indicating that grids across scales (SR2) were almost as coherent with each other as grids of the same scale (SR1). Dashed lines represent the control distributions generated by assigning a random phase and orientation response to each grid.

DOI: http://dx.doi.org/10.7554/eLife.21354.023

Figure 8.

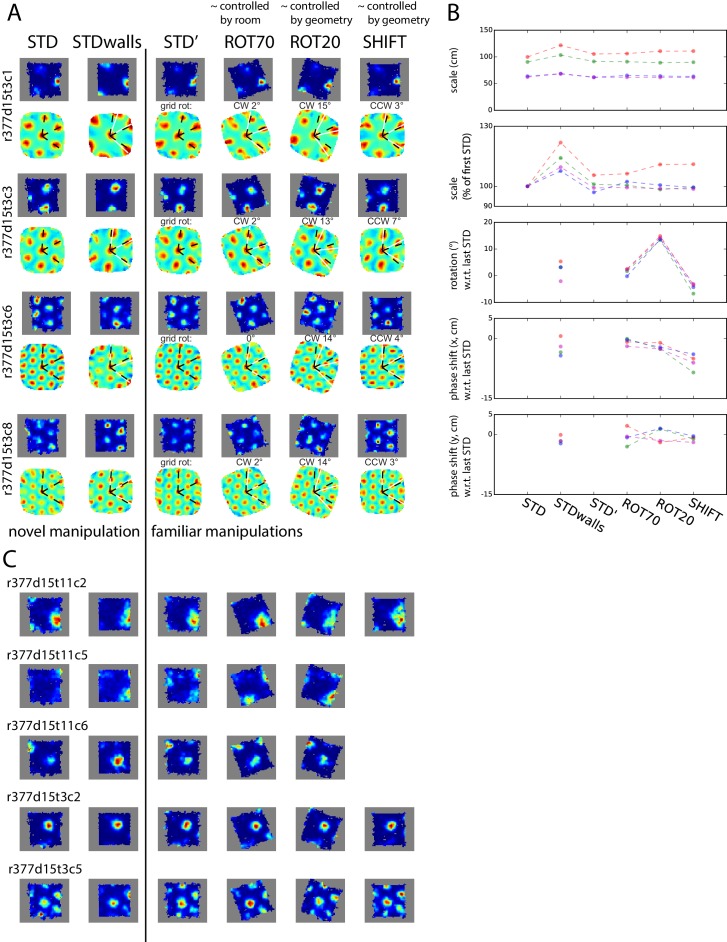
Figure 8—figure supplement 1. Simultaneously recorded grid cells from one day during novel and familiar manipulations.

Figure 8—figure supplement 1.

In this particular day and rat only, the lips of the platform were replaced by tall walls in a second STD session (STDwalls) before a third STD session (STD’) was run to commence the usual manipulations. STDwalls elicited varying degrees of rescaling of the autocorrelogram’s grid pattern (Barry et al., 2012). In the following sessions, all cells showed tight geometric coupling whether they were controlled by the room (in ROT70) or by the platform (in ROT20 and SHIFT). (A) Rate maps and autocorrelograms of 4 grid cells: in the sessions following STD’, all possible pairwise cell combinations for any manipulation have rotational dissociation < 4° and joint correlation > 0.7. (B) Quantification and evolution of grid features of the cells in A, each cell in different color. Note the tight coordination of orientation and phase in the last four sessions, but a mildly divergent rescaling in the novel condition (STDwalls). (C) Additional cells that passed the grid test in at least one but not all sessions. Visual inspection (and quantification where possible – not shown) of these cells indicate that their response was consistent with A, B.
Figure 8—figure supplement 2. Weak or no relationship between grid coordination and (A) magnitude of dissociation of grids from any reference frame and (B) amount of experience.

Figure 8—figure supplement 2.

Same data and measures as in Figure 8, replotted as a function of: (A) the grid angular drift from different reference frames elicited by the manipulation (minimum drift by either grid in the pair); and (B) previous experience with the manipulation (number of trials since the first experiment day). Spearman’s rank correlations (rho) are annotated. Note that while some of the correlations are statistically significant, all of the correlation coefficients are very small.