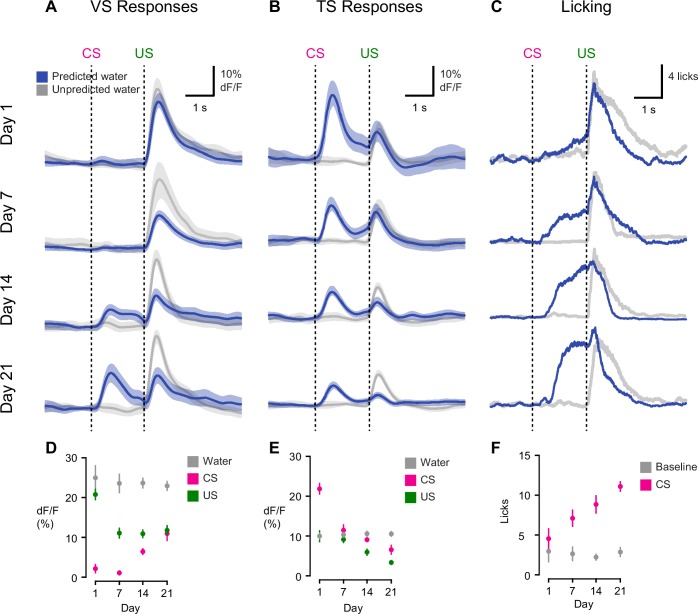
Figure 3. Opposite dynamics of VS and TS dopamine during initial learning of new odor-reward associations.
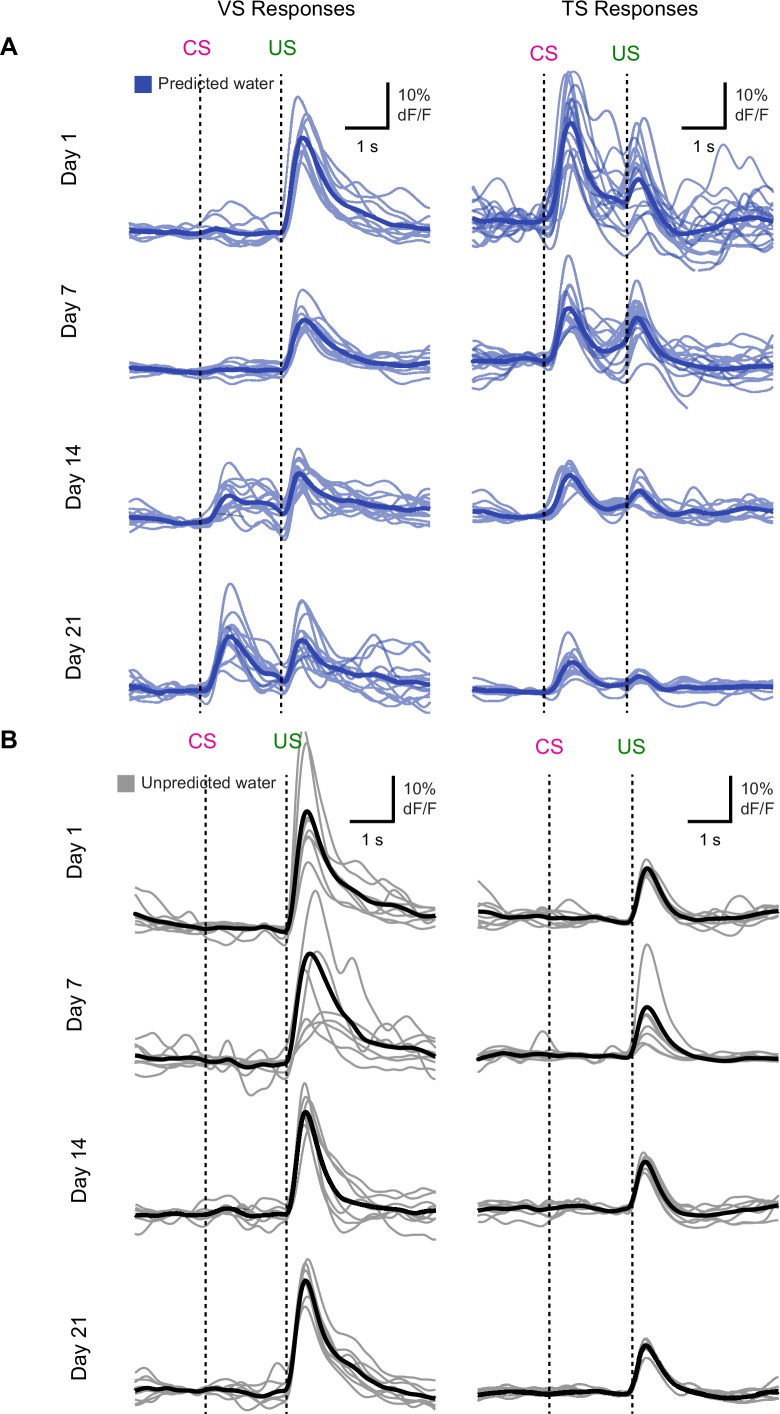
Learning dynamics for VS dopamine (A) and TS dopamine (B) over the course of 3 weeks of training, as naïve animals learn an association between an odor and reward. Odor onset (CS) and water delivery time (US) are shown as dotted lines. Responses are compared on day 1, day 7, day 14, and day 21. The average traces are plotted in blue (predicted reward) and black (unpredicted reward), with the standard error of the mean (SEM). Individual animals’ responses can be found in Figure 3—figure supplement 1. (C) Average licking in response to reward-predicting odor (blue) compared to average licking in response to unexpected reward (black). (D) A quantification of the CS and US responses in VS from the above traces, over training compared to responses to unexpected water (black). (E) A quantification of the CS and US responses in TS from the above traces, over training, compared to responses to unexpected water (black). (F) The average number of anticipatory licks in the period between odor presentation and water delivery, compared over days of training.


