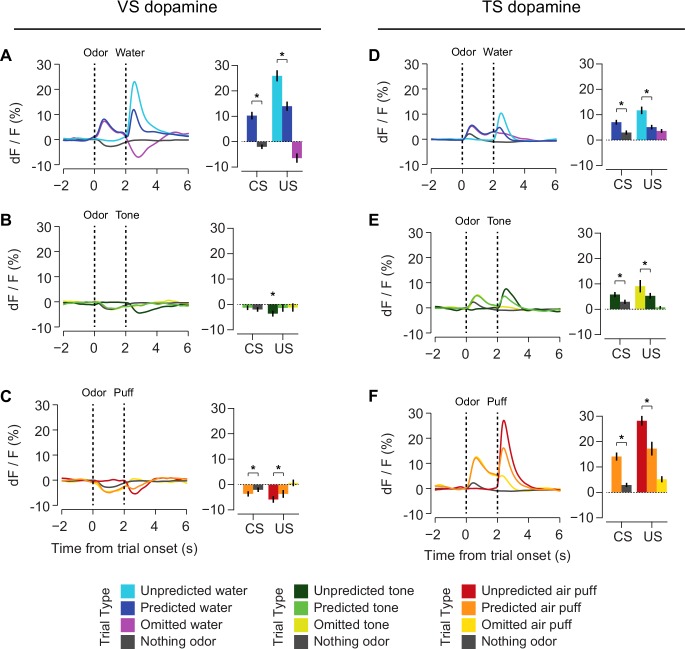
Figure 6. Responses to rewarding, aversive and neutral stimuli in VS and TS dopamine.
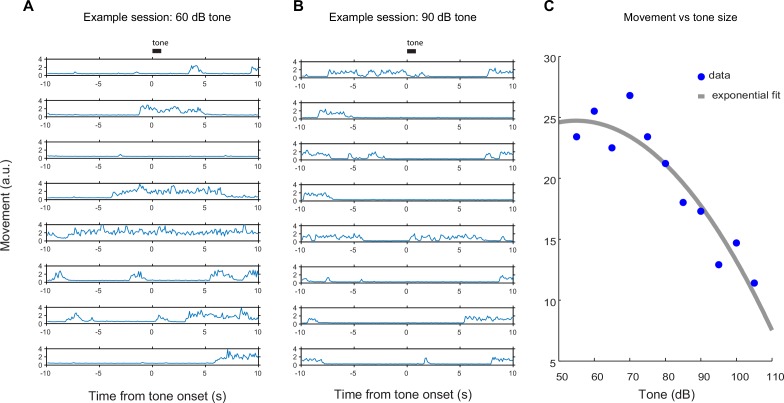
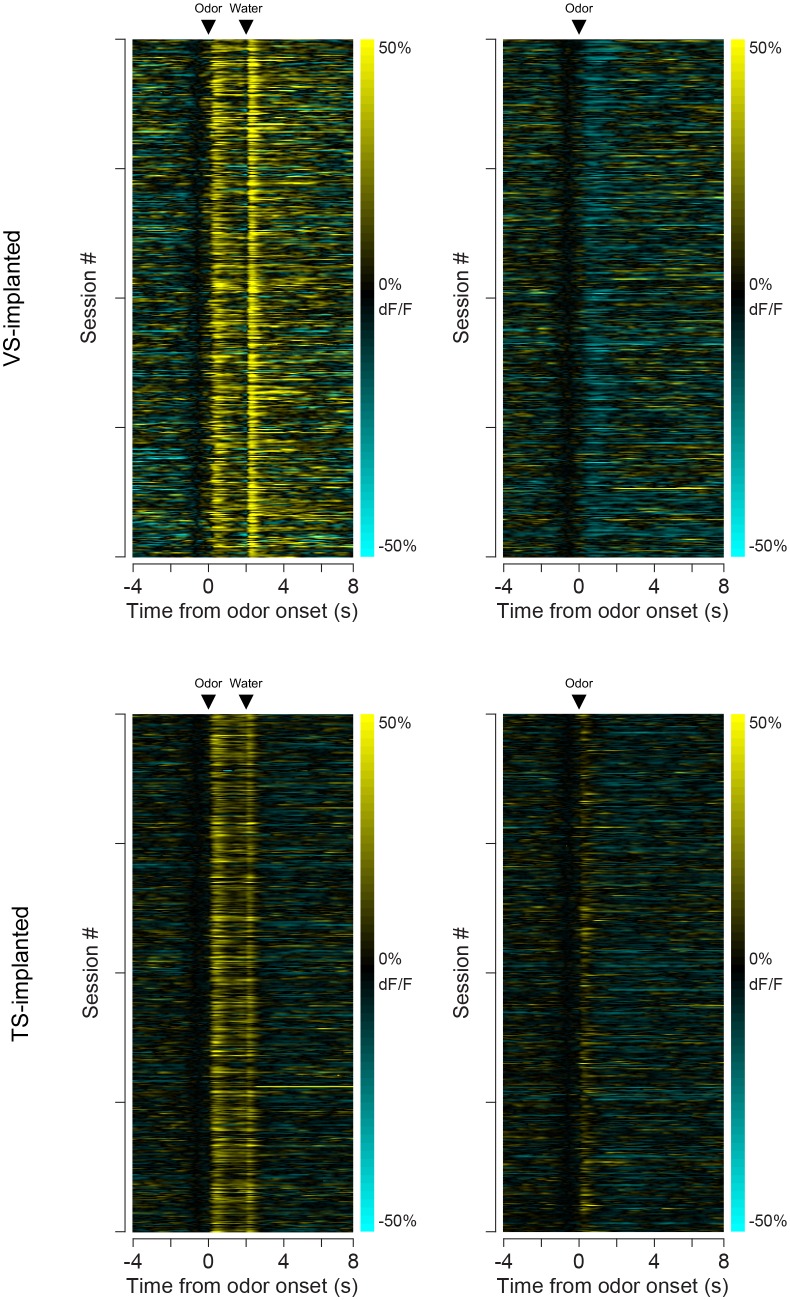
Dopamine responses to water (A), tone (B), and air puff (C) in the ventral striatum and the posterior tail of the striatum (D–F). Plots of average traces from each region contain dotted lines indicating odor (CS) and outcome (US) delivery times. (A, D) Responses to unpredicted reward (cyan), predicted reward (blue), omitted reward (purple), and nothing odor (grey) are plotted in the left panels. For each trace, a quantification of the average peak response to the CS / US is shown on the right. (B, E) Responses to unpredicted tone (dark green), predicted tone (light green), omitted tone (yellow), and nothing odor (grey) are plotted in the left panels. For each trace, a quantification of the average peak response to the CS / US is shown on the right. (C, F) Responses to unpredicted air puff (red), predicted air puff (orange), omitted air puff (yellow), and nothing odor (grey) are plotted in the left panels. For each trace, a quantification of the average peak response to the CS / US is shown on the right. Data from individual sessions is shown in Figure 6—figure supplement 2. Behavioral responses to the tone are shown in Figure 6—figure supplement 1.


