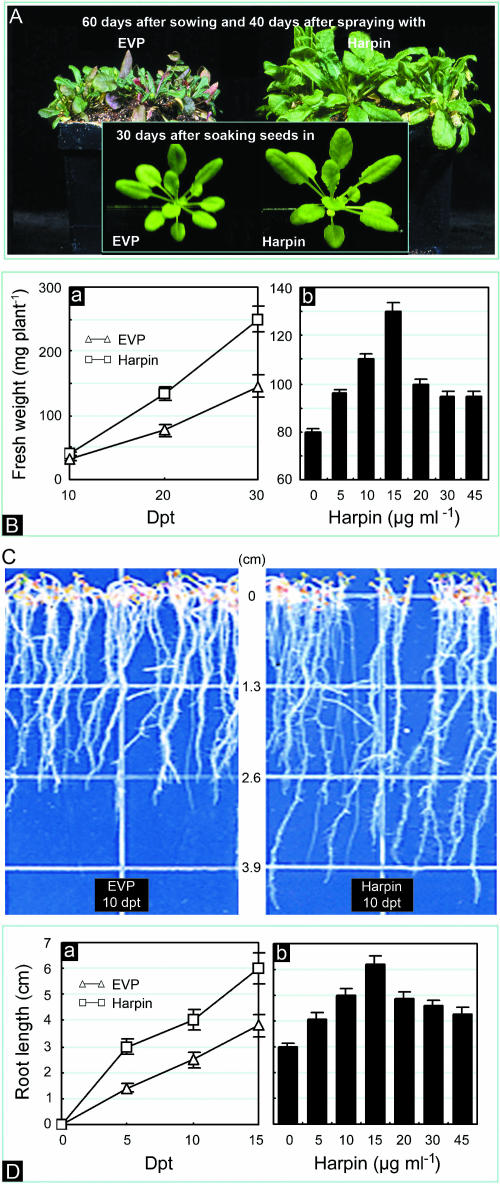
Figure 1.
Effects of harpin on the growth of Arabidopsis. A, Appearance of plants grown in pots. B, Quantification of plant growth in pots. Subsection a, Increase in plant weight with time. Subsection b, Effects of harpin dose on growth. C, Appearance of roots grown on agar medium. D, Quantification of root growth on agar medium. Subsection a, Increase of root length with time. Subsection b, Effects of harpin dose on root growth. Plants in A and B were grown in pots in a controlled-environment chamber. Harpin at 15 μg mL−1, or the indicated dose, and 15 μg mL−1 EVP were applied 20 d after sowing by spaying plants to runoff. The plants shown in the insets in A are representative of those grown from seeds that were soaked in 15 μg mL−1 harpin or 15 μg mL−1 EVP for 6 h. Plants shown in the pots in the main photo of A were grown from untreated seeds. In B, plant weight was determined at the indicated times (a) or at 25 dpt (b). In C, plants shown are representative of those that grew from seeds soaked in 15 μg mL−1 harpin or 15 μg mL−1 EVP for 6 h prior to sowing on agar medium. In D, root length was measured at indicated times (a) or at 15 dpt (b). Quantitative assays were done 20 (A and B) or 10 (C and D) times; each assay was done with 3 replicates (B–D); each replicate involved 5 plants. In graphs and histograms (B and D), bars refer to statistical deviation.

